|
3. EXTERNAL DEVELOPMENT ASSISTANCE
3.1 PLEDGES AND DISBURSEMENTS OF OFFICIAL DEVELOPMENT
ASSISTANCE (ODA)
32. Over the years, the
external development partners of
Cambodia
have been generous in providing support to its development programs. The
International Donor Community pledged to provide a total of 5.66 billion
US dollars of development assistance to Cambodia at the three ICORC
meetings and at the six Consultative Group Meetings that have been held
since 1992. The CG meetings were not held in 1998 and 2003, as such no
explicit pledges were made by donors for the years 1998 and 2003.
Nevertheless, the international community had disbursed US $ 433.3 million
in 1998 and US $ 549.1 million in 2003 as development assistance to
Cambodia. Including the disbursements in 1998 and 2003, a total of around
US$ 5.2 billion have been disbursed by the end of 2003.
Table 1: ODA PLEDGES AND
DISBURSEMENTS: 1992 - 2003
(in millions of US $)
|
|
1992 & 1993 |
1994-1998 |
1999-2003 |
TOTAL
1992-2003 |
|
Pledges |
1,000.0 |
2,284.2a |
2,376.4b |
5,660.6c |
|
Disbursements |
572.1 |
2,205.9 |
2,415.1 |
5,193.1 |
|
Disbursements
as % of Pledges |
57.2% |
79.8%d |
78.7%e |
74.4% |
a
Does not include
data for 1998, when the CG Meeting was not held and therefore no pledges
were made.
b
Does not include
data for 2003, when the CG Meeting was not held and therefore no pledges
were made.
c
Does not include
data on pledges for the years 1998 and 2003 when no CG meetings were held.
d
Excluding data on
disbursements for the year 1998 for which no pledges were made.
e
Excluding
data on disbursements for the year 2003 for which no pledges were made.
33. At the Ministerial Conference on the
Rehabilitation and Reconstruction of Cambodia, held in
Tokyo
in June 1992, and in response to appeal by the UN Secretary General,
donors pledged to provide around US$ 880 million. Additional pledges were
made at the first meeting of the International Committee for the
Reconstruction and Rehabilitation of Cambodia (ICORC), held in
Paris in September 1993,
raising the total pledges for 1992 and 1993 to US$ 1 billion. At the
second meeting of the ICORC, held in Tokyo in March 1994, and the third
meeting of the ICORC, held in Paris in March 1995, donors pledged to
contribute some 770 million US$ and 520 million US$, respectively. The
first Consultative Group Meeting for Cambodia was held
in 1996 at which the major development partners
of Cambodia pledged to provide US$ 501 million for the year 1996 and the
NGOs an additional 18 million US$. At the 1997, 1999, 2000, and 2001 CG
meetings, the major development partners, excluding NGOs, had pledged US $
450 million, 471 million, 548 million, and 556 million respectively. At
the last CG meeting held in 2002, the pledges of the major multilateral
and bilateral development partners amounted to US$ 635 million. As noted
above, a CG meeting was not held in 1998 and 2003, therefore no formal
pledges were made for the years 1998 and 2003.
34. It should also be noted that there is some double counting in the
pledges made by multilateral and bilateral development partners of
Cambodia. The pledges made by the
CHART 1: ODA
PLEGES AND DISBURSEMENTS: 1992-2003
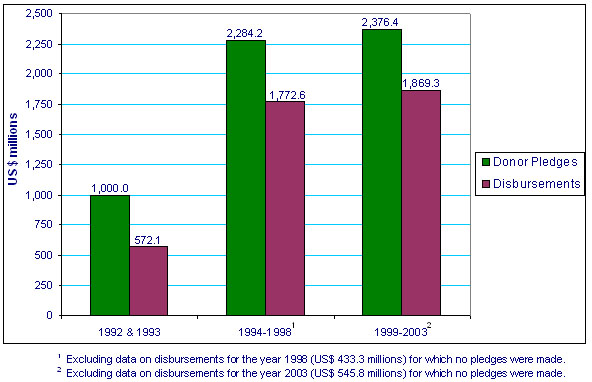
multilateral agencies, in particular UN System agencies, reflect the
anticipated funding level of the programs that they expect to “deliver”
irrespective of the source of funding. Some of these “programs delivered”
are funded by the in-country operations of the bilateral development
partners. The funding provided by in-country bilateral donors to
multilateral agencies is also included in their pledges, thus causing a
double counting in the reported data. A similar situation also exists in
the case of funding for some NGO activities.
35. The problem of double counting also exists in the disbursement data
reported by bilateral and multilateral donors as well as NGOs. In the case
of disbursements by multilateral institutions, CDC has made an attempt to
address the issue of double counting by reporting their disbursements data
under the following two headings:
·
Disbursements on "programs delivered" that include
the value of the all programs delivered consisting of both the UN agencies
"own resources" as well as resources mobilized from other in-country
sources.
·
Disbursements of "own resources" only.
In the case of NGOs, an estimate of disbursements of their "own/core
funds" has been prepared based on data provided by NGOs to the CDC/CRDB's
NGO Coordination Department. This estimate is based on an analysis of the
data on the sources of funding of each reporting NGO and excluding from
the estimate contributions from in-country bilateral and multilateral
sources.
Table 2: PLEDGES AND
DISBURSEMENTS: 1999 - 2003
(in millions of US $)
|
Donor Pledges and
Disbursements
|
1999
Actual |
2000
Actual |
2001
Actual |
2002
Actual
|
2003a
Provisional |
TOTAL
1999-2003
US$ % |
|
Donor Pledges
▪ UN
Agencies
▪ IFIs
▪ EU
Countries & EC
▪ Bilateral
donors, excluding
EU member countries
▪ NGOs
|
51.3
152.0
109.8
158.3
56.0
|
55.0
186.5
92.5
214.3
55.0
|
75.6
195.0
52.9
232.2
55.0
|
87.8
214.6
119.2
213.4
b
|
…..
…..
…..
..... |
269.7
748.1
374.4
818.2
166.0
|
11.4%
31.5%
15.7%
34.4%
7.0%
|
|
TOTAL |
527.4 |
603.3 |
610.7 |
635.0c
|
|
2,376.4d |
100.0% |
|
Disbursements
▪ UN
Agencies
-
“Programs Delivered”
-
"Own Resources"
▪ IFIs
▪ EU
Countries & EC
▪ Bilateral
donors, excluding
EU member countries
▪ NGOs
TOTALe |
90.1
45.3
65.1
94.7
139.7
55.0
399.7 |
86.5
49.4
95.3
110.8
159.5
51.9
466.8 |
90.8
44.9
114.7
100.6
168.0
43.6
471.8 |
81.8
42.2
149.2
111.6
182.3
45.6
530.9 |
83.9
41.8
149.3
126.3
181.2
47.2
545.8 |
433.2
223.7
573.6
544.0
830.6
243.2
2,415.1 |
17.9%
9.3%
23.8%
22.5%
34.4%
10.1%
100.0% |
|
Disbursements as % of
Pledges |
75.8% |
77.4% |
77.3% |
83.6% |
.... |
78.7%f |
........ |
a The CG
Meeting was not held in 2003 and therefore no pledges were made.
b The amount
pledged not stated at the CG Meeting.
C Does not include the NGOs.
d Excluding
the year 2003.
e Includes
only "own resources" disbursed by multilaterals.
f
Excluding data on
disbursements for the year 2003 for which no pledges were made.
36. During the second mandate of the RGC disbursements have
steadily increased from just under US$ 400 million in 1999 to over US$ 530
million in 2002, and the preliminary estimates indicate that they were
around US$ 545 million in 2003 (Table 2). Also, during this period, the
amounts pledged by our development partners have steadily increased from
around US$ 527 million in 1999 to US$ 635 million in 2002. In 2003, CG
meeting was not held and consequently no formal pledges were recorded.
Over the period of 1999-2002, the ratio of disbursements to pledges has
also steadily increased from 75.8 percent in 1999 to 83.6 percent in 2002.
The RGC is gratified by the support of its external development partners
and hopes that they will continue to provide their support to enable the
RGC to achieve its goal of reducing poverty among its people during its
third mandate.
|