3.7 DISBURSEMENTS BY PROVINCE IN 2002 AND
2003
61. The Royal Government needs reliable information on the regional
distribution of the ODA to ensure that ODA supported activities are in
line with the Government's regional development priorities. In its annual
surveys on External Development Assistance for the years 2002 and 2003,
the Council for the Development of Cambodia (CDC) has been attempting to
collect information on the geographic location of the
activities/beneficiaries of ODA supported activities. It appears that
some development partners have been having difficulties in providing this
information. In the year 2002, the geographic location of program/project
activities/beneficiaries was "not reported" for 11.9 percent of ODA
disbursed in 2002 (Table 13). In 2003, for 20.5 percent of the ODA that
has been reported to have been disbursed information on the geographic
location of the program/project activities was "not reported".
Notwithstanding the relatively high proportion of ODA for which geographic
location has not been reported, the data does provide some insights. In
view of the importance of this information, CDC would like to request its
development partners to make a serious attempt to provide this information
in completing future annual surveys of External Development Assistance.
TABLE 13: ODA DISBURSEMENTS BY PROVINCE: 2002 & 2003
|
PROVINCE |
DISBURSEMENTS in thousands of US$ |
|
2002 |
2003 |
|
US$ |
% |
US$ |
% |
|
|
5,241 |
1.0% |
|
|
|
|
16,665 |
3.1% |
|
|
|
|
23,350 |
|
|
|
|
|
11,669 |
|
|
|
|
|
8,965 |
|
|
|
|
|
14,964 |
|
|
|
|
|
6,347 |
1.2% |
|
|
|
|
9,074 |
1.7% |
|
|
|
|
979 |
0.2% |
|
|
|
|
1,924 |
0.4% |
|
|
|
|
696 |
|
|
|
|
|
103,965 |
19.6% |
|
|
|
|
2,219 |
|
|
|
|
|
9,906 |
1.9% |
|
|
|
|
8,143 |
1.5% |
|
|
|
|
1,081 |
|
|
|
|
|
28,702 |
5.4% |
|
|
|
|
|
|
|
|
|
|
934 |
|
|
|
|
|
7,310 |
1.4% |
|
|
|
|
10,281 |
1.9% |
|
|
|
|
3,313 |
|
|
|
|
|
158 |
|
|
|
|
|
573 |
|
|
|
|
|
180,038 |
33.9% |
|
|
|
|
63,220 |
11.9% |
|
|
|
TOTAL |
530,923 |
100.0% |
545,842 |
|
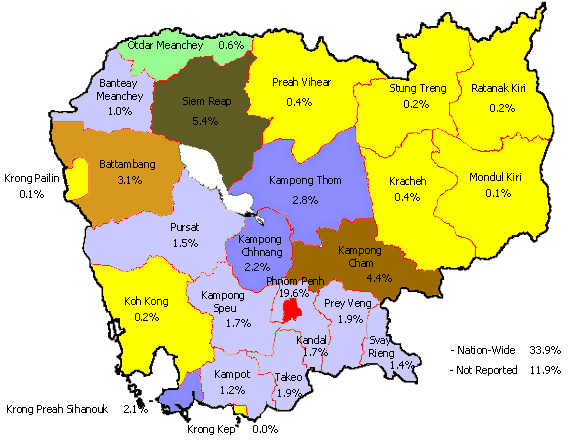
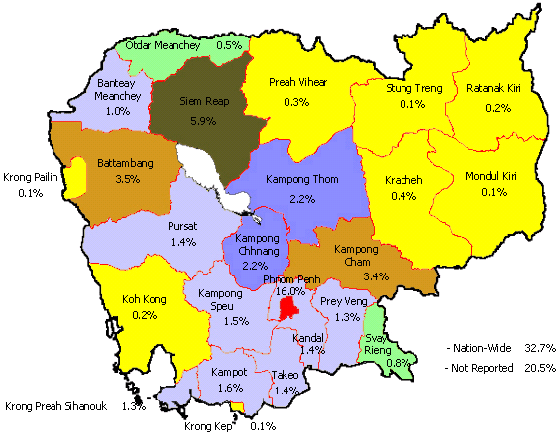
CHART 7: PERCENT OF
ODA DISBURSEMENT BY PROVINCE
2002
2003
* This is
not an official map of the boundaries and is presented here only
illustrate the distribution of ODA by region.
62. The highlights of the
data on ODA disbursements by province provided by development partners for
the years 2002 and 2003 are summarized below:
-
For just under
two-third of ODA reported to have been disbursed in 2002, and over
two-third in 2003, the geographic location of ODA supported
programs/projects activities was reported as "Nation-Wide" or "Phnom
Penh" or was "Not Reported" (Table 13).
|
Percent of Total ODA Disbursed |
|
|
2002 |
2003 |
|
Nation-Wide |
33.9% |
32.7% |
|
Phnom Penh |
19.6% |
16.0% |
|
Not Reported |
11.9% |
20.5% |
|
Total |
65.4% |
69.2% |
-
After Phnom Penh, the
province of Siem Reap received the second highest proportion of ODA in
both 2002 and 2003. It received 5.4 percent of total ODA disbursed in
2002 and 5.9 percent of the ODA disbursed in 2003.
-
In addition to Phnom
Penh and Siem Reap, the other provinces in a list of the top ten
provinces that have received the most ODA either in 2002 or 2003 is as
follows:
|
Percent of Total ODA Disbursed
|
|
|
2002 |
2003 |
|
Kampong Cham |
4.4% |
3.4% |
|
Battambang |
3.1% |
3.5% |
|
Kampong Thom |
2.8% |
2.2% |
|
Kampong Chhnang |
2.2% |
2.2% |
|
Krong Preah
Sihanouk |
2.1% |
1.3% |
|
Takeo |
1.9% |
1.4% |
|
Prey Veng |
1.9% |
1.3% |
|
Kandal |
1.7% |
1.4% |
|
Kampong Speu |
1.7% |
1.5% |
|
Kampot |
1.2% |
1.6% |
|
Province |
Amount and Percent of Total ODA
Disbursed |
|
2002 |
2003 |
|
US$ in '000 |
% |
US$ in '000 |
% |
|
Krong Kep
Krong Pailin
Mondul Kiri
Stung
Treng
Koh Kong
Ratanak
Kiri |
158
573
696
934
979
1,081 |
0.03%
0.1%
0.1%
0.2%
0.2%
0.2% |
558
276
331
578
1,022
948 |
0.1%
0.05%
0.06%
0.1%
0.2%
0.2% |
63. Detailed data on the
contribution of various donor categories (UN System Agencies, IFIs, EU,
etc.) in each province is presented as Annex VI.
|