3.6 DISBURSEMENTS BY SECTOR AND DONOR IN
2002 and 2003
56. The highlights of the
disbursements data by the top five sectors and donor reported for the
years 2002 and 2003 are summarized below.
YEAR 2002
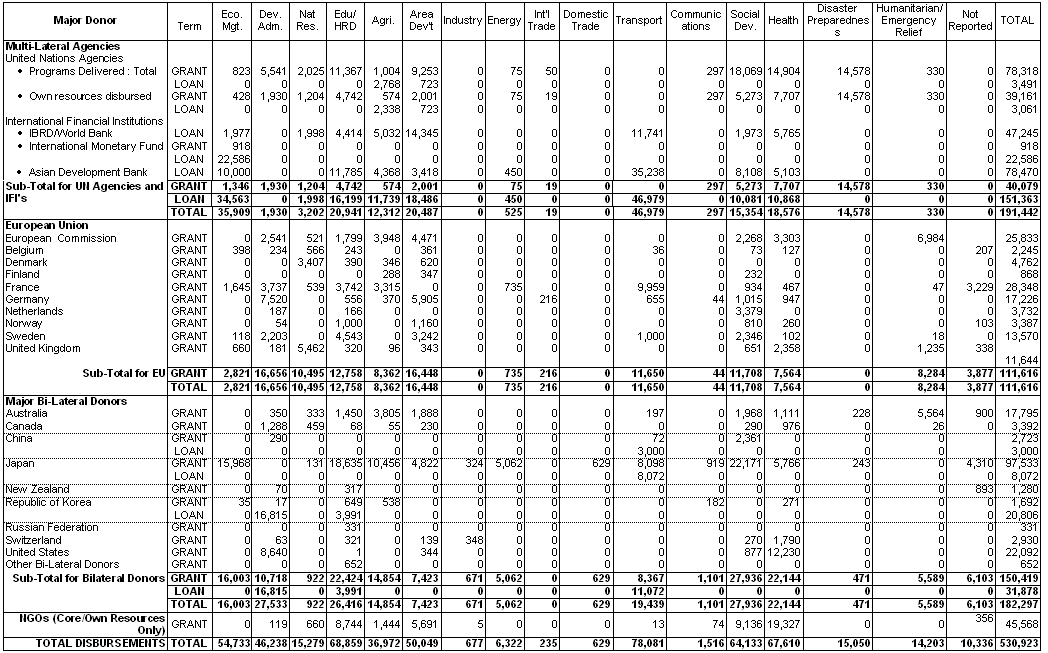
57. In the year 2002, the
top five sectoral composition of ODA provided by its top five development
partners was as follows (Table 11):
-
Transport/Infrastructure, total ODA received in 2002 - 78.1 million US$
representing 14.7 percent of total ODA in 2002 - five main contributors
were: Asian Development Bank, Japan, World Bank, France, and China.
-
Education/HRD, total
ODA received in 2002 - 68.9 million US$ representing 13.0 percent of
total ODA in 2002 - five main contributors were: Japan, Asian
Development Bank, UN Agencies, Republic of Korea, and Sweden.
-
Health, total ODA
received in 2002 - 67.6 million US$ representing 12.7 percent of total
ODA in 2002 - five main contributors were: United States of America, UN
Agencies, Japan, World Bank, and European Commission.
-
Social Development -
total ODA received in 2002 – 64.1 million US$ representing 12.1 percent
of total ODA in 2002 - five main contributors were: Japan, Asian
Development Bank, UN Agencies, Netherlands, and China.
-
Economic Management,
total ODA received in 2002 - 54.7 million US$ representing 10.3 percent
of total ODA in 2002 - five main contributors were: IMF, Japan, Asian
Development Bank, World Bank, and France.
Information on the
sectoral composition of the ODA disbursed by other bilateral and
multilateral donors in the year 2002 is presented in Table 11.
58. The development
assistance from the NGOs in 2002 was concentrated in the following areas:
Health sector, Social Development sector, Education/HRD sector, Area
Development, Agriculture, Forestry and Fisheries sector, Natural Resources
sector, and Development Administration.
YEAR 2003
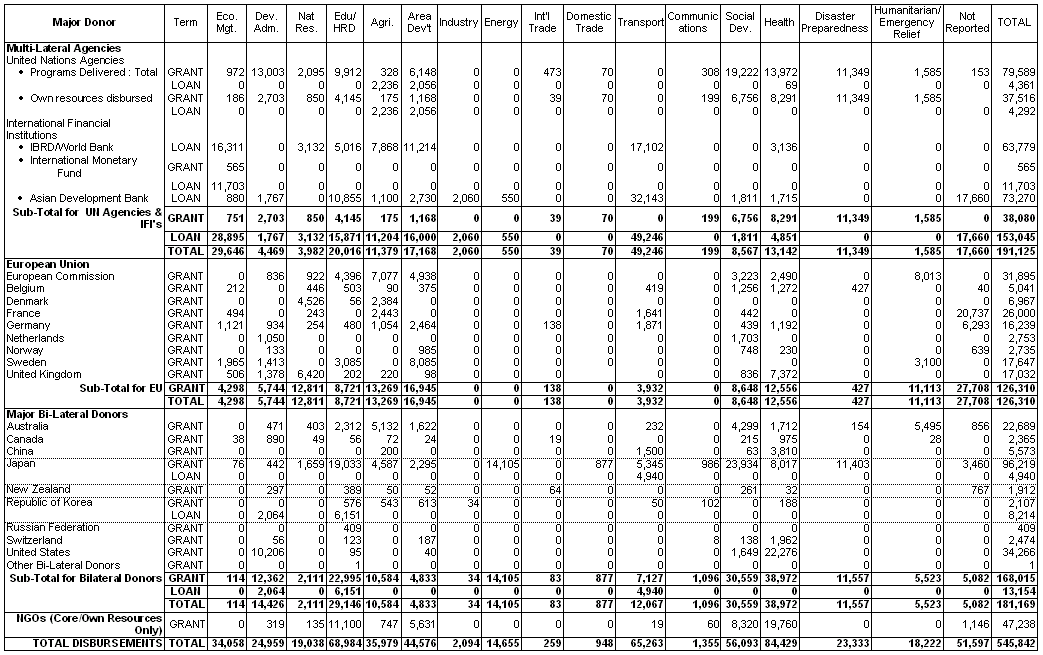
59. In the year 2003,
the top five sectoral composition of ODA provided by its top five
development partners was as follows (Table 12):
-
Health,
total ODA received in 2003 – 84.4 million US$ representing 15.5 percent of
total ODA in 2003 - five main contributors were: United States of America,
UN Agencies, Japan, United Kingdom, and China.
-
Education/HRD,
total ODA received in 2003 – 69.0 million US$ representing 12.6 percent of
total ODA in 2003 - five main contributors were: Japan, Asian Development
Bank, Republic of Korea, World Bank, and European Commission.
-
Transport/Infrastructure, total ODA received in 2003 – 65.3 million US$
representing 12.0 percent of total ODA in 2003 - five main contributors
were: Asian Development Bank, World Bank, Japan,
Germany, and France.
-
Social
Development - total ODA received in 2003 – 56.1 million US$ representing
10.3 percent of total ODA in 2003 - five main contributors were: Japan, UN
Agencies, Australia, European Commission, and Netherlands.
-
Area/Rural Development, total ODA received in 2003 – 44.6 million US$
representing 8.2 percent of total ODA in 2003 - five main contributors
were: World Bank,
Sweden, European Commission, UN Agencies, and Asian Development Bank.
Additional information
on the sectoral composition of the ODA disbursed by other bilateral and
multilateral donors in the year 2003 is presented in Table 12.
60. The development
assistance from the NGOs in 2003 was concentrated in the following areas:
Health sector, Education/HRD sector, Social Development sector, Area/Rural
Development, Agriculture, Forestry and Fisheries sector, Development
Administration, and Natural Resources sector.
TABLE
11: DISBURSEMENTS BY DONOR AND SECTOR: 2002
(in thousands of US Dollars)
|


