|
|
 |
 |
 |
||
|
|
|
|
|
|
|
||
|
|
|
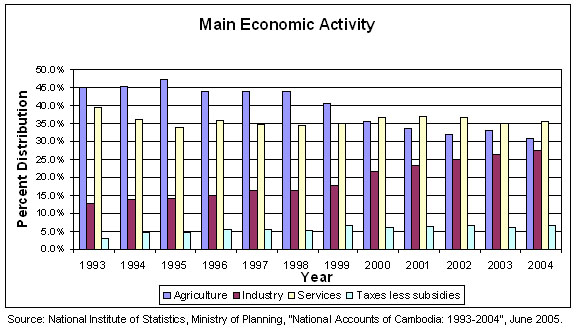
17. The Royal Government of Cambodia has continued to make significant progress in implementing a macroeconomic framework that is aimed at achieving equitable long-term economic growth and sustainable development. The focus of this framework has been on maintaining macroeconomic stability, strengthening the banking and financial institutions, implementing fiscal reform measures, ensuring a sound management of public property, and increasing public investment to develop the physical and social infrastructure and human resources of the nation. For the Royal Government, growth is the most powerful weapon in combating poverty and it remains committed to pursuing policies that encourage macroeconomic stability, shifting resources to more efficient sectors, and integrating within the global economy. The maintenance of political stability, peace and a greater sense of security among citizens have helped the Royal Government to consolidate, broaden and deepen the reforms that are underway and to maintain the momentum of sustainable social and economic development. 18. The RGC’s focused efforts to strengthen macroeconomic management and the implementation of the fiscal reforms has resulted in robust economic performance in 2004 and 2005, in spite of negative external factors such as higher oil prices, SARS epidemic and concerns about the on-going avian flu, and adverse weather conditions in 2004. In 2004, real GDP grew by 7.7 percent, as compared to the revised GDP growth of 7.0 percent in 2003 and 5.2 percent in 2002. The preliminary estimate indicates that the economy grew by 7 percent in 2005, reflecting stronger growth in the agriculture sector, continued expansion of exports, tourism and construction activities. The estimated nominal GDP for 2004 and 2005 was 19,630 billion CRs (approximately US$ 4.9 billion), and 22.086 billion CRs (approximately US$ 5.4 billion). 19. In terms of the contribution of the main economic sectors to overall GDP, in constant 2000 prices, the agriculture, fisheries and forestry sector in 2004 accounted for 31.1 percent of GDP compared with 45.4 percent in 1993. The contribution of industrial sector continues to grow, more than doubling from 12.8 percent in 1993 to 27.5 percent in 2004, due to the rapid expansion in the textile, wearing apparel and footwear industry and continued strong construction activity. Although there has been significant growth in tourist oriented services sector, as a result of the rapid expansion in the industry sector, the share of the services sector in total GDP has declined from 38.8 percent in 1993 to 35.8 percent in 2004. 20. Due to drought, late floods and declining forestry production, the output of the agriculture, fisheries and forestry sector declined in 2004 by 2.0 percent as compared to an increase of 12.2 percent in 2003. Crops and fisheries gross value added declined 3.4 and 3.3 percent, respectively. Gross value added for inland and marine fish catch continued to trend downwards in 2004, with decreases of 4.6 and 7.8 percent, respectively. The livestock and poultry grew by 4.3 percent. In the forestry and logging sector gross value added increased slightly, by 0.2 percent, in 2004. The turn around is due mainly to the strong growth in logging for timber for use in domestic construction and furniture manufacturing, offset by the continuing decline in illegal logging for export. Agricultural production grew by 4.5 percent in 2005, led by a 20 percent rebound in rice production. |
|
||||||||||||||||||||||||||||||||||||||||||||||||||||||||||||||||||||||||||||||||||||||||||||||||||||||||||||||||||||||||||||||||||||||||||||||||||||||||||||||||||||||||||||||||||||||||||||||||||||||||||||||||||||||||
|
Source:
Ministry of Economy and Finance, National Bank of Cambodia; and National
Institute of Statistics, Ministry of Planning |
|
|
21. The industry sector grew by 16.1 percent in 2004, as compared to 11.9 percent in 2003. The sector is dominated by manufacturing (75.4 percent) and construction (22.0 percent). Textile, wearing apparel and footwear manufacturing value added increased by 24.9 percent in 2004, following increases of 16.9 percent and 21.2 percent in 2003 and 2002 respectively. Exports in GSP products, mainly manufactured garments, have grown from 82.6 percent of Cambodia’s total goods exports in 2003 to 88.8 percent in 2004. Construction value added also contributed strongly to 2004 growth, increasing by 13.2 percent compared to increases of 11.1 percent and 27.1 percent in 2003 and 2002 respectively. In 2005, the industrial sector grew by 10.7 percent, reflecting the continuing strength of the garment manufacturing sector that grew by 10.2 percent and the construction sector that grew by 13 percent. The value of garments exported increased from US$ 1.98 billion in 2004 to US$ 2.17 billion in 2005. 22. The services sector grew by 9.2 percent in 2004, as compared to 0.2 percent in 2003. Tourism continues to be the main contributor to growth in the services sector, with travel receipts from overseas tourists increasing by 50.4 percent in 2004. Tourists from overseas helped to contribute to growth in the hotel and restaurant industry (23.6 percent); transport and communications industry (6.2 percent); and other services (18.5 percent). In 2005, the services sector grew by 6.2 percent in real terms, with value added by hotels and restaurants increasing by 15 percent.
TABLE 2: GDP BY MAIN ECONOMIC ACTIVITY IN CURRENT PRICES 23. Estimated nominal per capita GDP in 2004 was 1.435 million CRs, an increase of 11.2 percent from 2003. It has grown at an average annual rate of 6.7 percent over the last four years. Population growth during the same period has averaged 1.9 percent per annum. In real terms, GDP per capita was 1.319 million CRs in 2004, an increase of 5.6 percent from 2003. Real growth in GDP per capita has averaged around 4.4 percent over the last four years. Per capita GDP in US dollars has shown reasonable real annual
TABLE 3: NATIONAL BUDGET INDICATORS |
| Particulars |
2001 |
2002 | 2003 | 2004 | 2005 | ||||||||||
| Budget Out-Turn | Budget Out-Turn | Budget Out-Turn |
Budget Out-Turn |
Estimated Budget | |||||||||||
|
in Billion CRs |
in Million US$ |
% of GDP |
in Billion CRs |
in Million US$ |
% of GDP |
in Billion CRs |
in Million US$ |
% of GDP |
in Billion CRs |
in Million US$ |
% of GDP |
in Billion CRs |
in Million US$ |
% of GDP |
|
| DOMESTIC REVENUE: |
1561 |
397.8 |
10.3 |
1,762 |
449.3 |
11 |
1776 |
446.7 |
10.2 |
2212 |
550.7 |
11.3 |
2,591 |
629.2 |
11.7 |
|
1. Tax Revenue Direct Taxes Indirect Taxes Customs Import Duties Other |
1128 |
287.4 |
7.5 |
1,245 |
317.5 |
7.7 |
1219 |
306.6 |
7.1 |
1648 |
410.3 |
8.4 |
1,929 |
468.4 |
8.7 |
|
140 |
35.6 |
0.9 |
132 |
33.6 |
0.8 |
150 |
37.7 |
0.9 |
158 |
39.3 |
0.8 |
212 |
51.5 |
1.0 |
|
|
572 |
145.7 |
4.0 |
654 |
166.7 |
4.0 |
635 |
159.7 |
3.7 |
895 |
222.8 |
4.6 |
1,086 |
263.7 |
4.9 |
|
|
376 |
95.8 |
2.5 |
424 |
108.1 |
2.6 |
395 |
99.3 |
2.3 |
516 |
128.4 |
2.6 |
560 |
136.0 |
2.5 |
|
|
41 |
10.4 |
.02 |
35 |
8.9 |
0.2 |
39 |
9.8 |
0.2 |
79 |
19.6 |
0.4 |
71 |
|
0.3 |
|
| 2. Non tax Revenue |
424 |
108 |
2.8 |
501 |
127.7 |
3.1 |
525 |
132 |
3 |
544 |
135.4 |
2.8 |
555 |
134.8 |
2.5 |
| 3. Capital Revenue (Domestic) |
9 |
2.2 |
0.01 |
16 |
4 |
0.1 |
31 |
7.7 |
0.1 |
19 |
4.7 |
0.1 |
106 |
|
0.5 |
| EXPENDITURE: |
2,516 |
641.1 |
16.9 |
2,963 |
755.6 |
18.5 |
2,946 |
741.1 |
17 |
2,970 |
739.5 |
15.1 |
3,294 |
799.9 |
14.9 |
|
1. Current Expenditure Defense & Security Civil Administration |
1,415 |
360.6 |
9.5 |
1,574 |
401.4 |
9.9 |
1,758 |
442.2 |
10.1 |
1,745 |
434.5 |
8.9 |
2,125 |
516.0 |
9.6 |
|
417 |
106.2 |
2.80 |
406 |
103.8 |
2.5 |
411 |
103.3 |
2.3 |
422 |
105 |
2.2 |
452 |
109.8 |
2.0 |
|
|
998 |
254.3 |
6.7 |
1,168 |
297.8 |
7.4 |
1,347 |
338.8 |
7.8 |
1,274 |
317.2 |
6.5 |
1,673 |
406.2 |
7.6 |
|
|
2. Capital Expenditure Locally financed investments Externally financed investments |
1,101 |
280.5 |
7.4 |
1,388 |
353.9 |
8.6 |
1,188 |
298.8 |
6.9 |
1,224 |
304.7 |
6.2 |
1,169 |
283.9 |
5.3 |
|
283 |
72.1 |
1.90 |
338 |
86.2 |
2.1 |
333 |
83.7 |
1.9 |
297 |
73.9 |
1.5 |
342 |
83.1 |
1.5 |
|
|
818 |
208.4 |
5.50 |
1,049 |
267.5 |
6.5 |
854 |
214.8 |
5 |
927 |
230.8 |
4.7 |
827 |
200.8 |
3.7 |
|
| DEFICIT/SURPLUS | |||||||||||||||
|
Overall |
(987) |
(251.7) |
(6.64) |
(1,219) |
(310.8) |
(7.6) |
(1,181) |
(297.1) |
(6.8) |
(864) |
-215.1 |
-4.4 |
-694 |
-168.5 |
-3.1 |
|
113 |
28.7 |
0.7 |
169 |
43.1 |
1.0 |
6 |
1.5 |
0.03 |
340 |
84.6 |
1.7 |
360 |
87.4 |
1.6 |
|
| GDP in | |||||||||||||||
| Billions of Cambodian Riels | 14,860 | 15,994 | 17,311 | 19,630 | 22,086 | ||||||||||
| Millions of US$ | 3,786.9 |
4,079.1 |
4,354.9 |
4,887.9 | 5,363 | ||||||||||
|
|
|