4.5     NATIONAL PERSONNEL EMPLOYED

4.5.1     RESULTS OF THE SURVEY

115.   A total of 6,397 Cambodian nationals were employed in 2002 by the 93 out of 147 programs/projects supported by multilateral and bilateral donors and by 67 out of 77 NGOs that have provided data in response to the CBP Survey (Table 21). It is notable that 54 out of 147 bilateral and multilateral projects (37 per cent) reported that they did not employ any Cambodian personnel. For NGO projects only 10 out of 77 NGOs (13 percent) reported not employing any Cambodian personnel (see table 24).

116.   Of the 6,397 national personnel employed:

  • 3,787 or 59.2 percent were employed by NGOs,

  • 1,897 or 29.7 percent by UN agencies,

  • 437 or 6.8 percent by IFIs, ADB and EC, and

  • 276 or 4.3 percent by the bilateral donors supported programs.

TABLE 21:  NUMBER OF AND EXPENDITURE ON NATIONAL PERSONNEL EMPLOYED

Donor category

National Personnel Employed
  No.                     %

Total Expenditure on National Personnel
(in US $ ‘000)

Average cost per person
(in US dollars)

Multilateral Donors

  • UN Agencies

  • IFIs, ADB, and EC

 2,334                36.5%

 1,897                29.7%
    437                 6.8%

  7,415

  5,382
  2,033

3,177

2,837
4,652

Bilateral Donors

    276                 4.3%

     986

3,572

NGOs

 3,787                59.2%

13,061

3,449

TOTAL

 6,397              100.0%

21,462

3,355

TABLE 22: NUMBER OF NATIONAL PERSONNEL EMPLOYED
BY DURATION OF EMPLOYMENT

DONOR CATEGORY

1-3
 Month
No.        %

4-6
Month
No.        %

7-9
 Month
No.        %

10-12
Month
No.        %

Not Reported

No.        %

TOTAL

No.        %

Multilaterals: Total
- UN Agencies
- IFIs, ADB & EC

87           3.7%
58           3.0%
29           6.6%

16         0.7%
 7          0.4%
 9          2.1%

34          1.5%
  9          0.5%
25          5.7%

1855      79.5%
1646      86.8%
 209       47.8%

342      14.7%
177        9.3%
165      37.8%

2,334   100.0%
1,897   100.0%
  437    100.0%

Bilateral Donors

73         26.4%

 1          0.4%

  2         0.7%

   27        9.8%

173       62.7%

  276    100.0%

NGOs

0             0.0%

11          0.3% 

 4           0.1%

3772      99.6%

    0       …

3,787    100.0%

Total

160         2.5%

 28         0.4%

40          0.6%

5654      88.4%

515        8.1%

6,397    100.0%

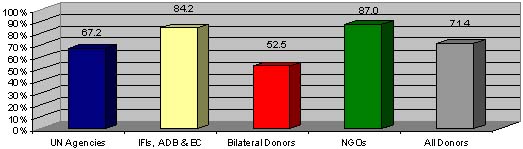
117.   The total expenditure on the 6,397 national personnel employed to support the implementation of these programs totaled just under 21.5 million US dollars, representing 8.1 percent of the total program expenditure in 2002. The average cost per person employed was 3,355 US dollars in 2002. There are significant differences in the average wage cost among the different categories of donors. The UN agencies have the lowest costs at 2,837 per person. The highest average cost per person of 4,652 US dollars is reported by the IFIs, ADB and the EC programs/projects followed by bilateral donors ($3,572) and the NGOs (3,449). The data on the duration of employment does not fully account for these differences (Table 22). The UN agencies that have the lowest average cost also have the highest proportion of national staff, 86.8 percent that are employed for 10-12 months, as compared to 47.8 percent for programs supported by IFIs, ADB and EC.

118.   Overall, nearly 90 percent of the national personnel, employed by projects for which data has been provided, were employed for a period of 10 to 12 months. This implies a long-term employment relationship with the donor programs/projects. It should be noted, however, that more than one-third of the programs supported by IFIs, ADB and EC did not report the duration of employment of their national staff. Similarly, nearly two-thirds of the programs supported by bilateral donors did not provide information on the duration of employment. A detailed tabulation of the data for multilateral and bilateral donor supported programs on the duration of employment by function performed by the national personnel is presented as Annex 4. These data show that there are no major variations in the duration of employment by function performed. In the case of NGOs, nearly all of the 3,787 national personnel were employed for 10-12 months, indicating that NGOs employ national staff on a long-term basis for their programs.

119.   A higher proportion of NGOs, 87 percent, employ national personnel to implement their programs than programs supported by IFIs, ADB and EC (84.2 percent), the UN agencies (67.2 percent), or the bilateral donors (52.5 percent) (Table 23). A significantly higher proportion of NGOs spent more than 100,000 US dollars in 2002 on the employment of Cambodia nationals, 45.5 percent, than the IFIs, ADB and EC programs (31.6 percent), the UN agencies (10.4 percent), or the bilateral donors (4.9 percent).

TABLE 23:  RANGE OF EXPENDITURE ON THE EMPLOYMENT OF NATIONAL PERSONNEL

Range of Expenditure

Number and Percent of Donor Projects Employing National Personnel

UN
Agencies

No. of
projects       %

IFIs, ADB
& EC

No. of
projects
        %

Bilateral Donors

No. of
Projects
        %

NGOs


No. of
NGOs
         %

TOTAL
 

No. of Projects
or NGOs
     %

Less than 10,000 USD
10,000 – 50,000 USD
50,001-100,000 USD
More than 100,000 USD

  13        19.4%
  22        32.8%
    3         4.5%
    7       10.4%

    0             … 
    8        42.1%
    2        10.5%
    6        31.6%

   14        23.0%
   10        16.4%
     5          8.2%
     3          4.9%

   6           7.8%
 16          20.8%
 10          12.9%
 35          45.5%

 33         14.7%
 56
         25.0%

 20           8.9%
 51         22.8%

Number of Projects Or NGOs That Employed National Personnel

  45        67.2%

  16         84.2%

  32          52.5%

 67          87.0%

160        71.4%

Number of Projects or NGOs That Did Not Employ National Personnel

  22        32.8%

   3         15.8%

  29          47.5%

 10          13.0%

  64        28.6%

Total Number of Responses to CBP Survey

  67      100.0%

  19       100.0%

  61        100.0%

 77        100.0%

224       100.0%


Figure 18: Percent of Programs that Employed National Personnel

120.   Nearly one-fourth of the programs/projects have reported employing between 2 and 5 national personnel. A larger proportion of UN agencies and bilateral programs/projects employ less than five national personnel than do NGOs or the IFIs, ADB and EC programs (Table 24). Nearly one-fourth of the NGOs have reported employing more than 50 national personnel, as compared to 3.0 percent of UN agencies. None of the bilateral programs/projects have reported employing more than 50 national personnel.

TABLE 24:  NUMBER OF NATIONAL PERSONNEL EMPLOYED TO SUPPORT
THE IMPLEMENTATION OF A PROGRAM/PROJECT  

Number of national personnel employed

UN
Agencies

No. of
projects         %

IFIs, ADB,
& EC

No. of
projects         %

Bilateral Donors

No. of
projects         %

NGOs
 

No. of
NGOs          %

TOTAL


No. of projects
or NGOs        %

  • 1 Person

  • Between 2-5 persons

  • Between 6-10 persons

  • Between 11-25 persons

  • Between 26-50 persons

  • More than 50 persons

  • No. of Persons Employed Not Reported

   5            7.5%
 25 
         37.3%
   6
             9.0%
   3
             4.5%
   3
             4.5%
   2             3.0%


   1             1.5%

                 ….
    3         15.8%
    4         21.1%
    4         21.1%
    2         10.5%
    2         10.5%


    1           5.3%
 

    1           1.6%
  17   
       27.9%
    5  
         8.2%
    3  
         4.9%
    3    
       4.9%
    0    
          ….


    3  
         4.9%

   3          3.9%
   5  
       6.5%
 11 
        14.3%
 21 
        27.3%
   9 
        11.7%
 18  
       23.4%


   0   
          ….

   9            4.0%
 50   
       22.3%
 26    
      11.6%
 31   
       13.8%
 17    
       7.6%
 22   
         9.8%


   5 
           2.2%

No. of Projects or NGOs That Employed National Personnel

 45            67.2%

  16           84.2%

  32           52.5%

 67           87.0%

160         71.4%

Total Number of Responses to CBP Survey

 67          100.0%

  19         100.0%

  61          100.0%

 77         100.0%

224        100.0%

121.   There is a wide variation in the monthly salary reported in the survey to have been paid to national personnel in what appear to be similar job titles (Table 25). The IFIs, ADB & EC programs employ a slightly higher proportion of national personnel as Program Directors/Managers/Coordinator, Technical Experts/Specialist/Engineers, and Consultants (15.5 percent) than bilateral donors supported programs (14.5 percent) or the UN agencies (5.8 percent). Nearly 70 percent of the national personnel employed by UN agencies were field staff, and another 16.5 percent were reported as support staff. In the case of IFIs, ADB and the EC and the bilateral programs the majority of the national personnel were employed as what has been reported as support staff, who were paid between 50 to 1,000 US dollars per month. In the case of NGOs, the majority (55.2 percent) of the 3,787 national personnel employed were field staff such as health workers, community development workers and technical assistants directly implementing projects at the field level. Another 19.4 percent were employed as program/technical officers, and 22.2 percent as support staff.

122.   It should be noted that this study was not meant to be a salary survey. However, the data collected does provide a picture of the salaries that were actually paid to national personnel in 2002 (Table 26). These data show that over 80 percent of the national personnel employed by UN agencies supported programs were paid between 100 and 300 US dollars per month. The bulk of these were employed in de-mining operations. Only 2.1 percent were paid over 1,000 US dollars per month. In the case of IFIs, ADB and EC, just under two-thirds were also paid between 100 and 300 US dollars per month. In the case of bilateral donors supported programs nearly half were paid between 500 and 1,000 US dollars per month. In the case of NGOs, half were paid between 100 and 300 US dollars per month and another one-third between 300 and 500 US dollars per month.


TABLE  25:   NUMBER OF NATIONAL PERSONNEL EMPLOYED BY FUNCTION PERFORMED AND RANGE OF MONTHLY SALARY

FUNCTION IN THE PROGRAM/PROJECT

NUMBER OF NATIONAL PERSONNEL EMPLOYED AND  RANGE OF MONTHLY SALARY

UN
AGENCIES

Range
Monthly
 No.     %        Salary

IFIs, ADB
and EC

Range
Monthly
 No.    %       Salary

BILATERAL
DONORS

Range
Monthly
 No.    %       Salary

 NGOs
 

Range
Monthly
 No.    %       Salary

TOTAL
 

Range
Monthly
 No.    %       Salary

National Program Director/Manager/ Coordinator

   37  2.0%  $500-2,250

   31  7.1%  $180-2,916

  18   6.5%  $400-2,000

  116  3.1% $400-3,000

  202  3.2% $180-3,000

Technical Expert/Specialist/Engineer

   52  2.7%  $500-2,000

  25   5.7%     $230-850

  11   4.0%  $300-2,000

    8  0.2% $300-1,300

   96  1.5% $230-2,000

Consultants

   21  1.1%  $350-1,200

  12   2.7%  $500-1,500

  11   4.0%  $500-1,500

    0     …

  44   0.7% $350-1,500

Project Officer/Technical Officer

  98   5.2%  $300-1,690

  92  21.1%   $40-1,350

 50  18.1%  $100-1,200

734  19.4% $100-1,500

974  15.2%  $40-1,690

Support Staff

313  16.5%   $70-1,458

242  55.4%     $50-900

157 56.9%  $70 - 1,000

839  22.2%   $50-1,020

1,551 24.2% $70-1,458

Field Staff

1,317  69.4%  $30-200

  16   3.7%      $40-180

    0    ….          …

2,090  55.2%    $30-500

3,423 53.5%   $30-500

Driver/cleaner/Guard

   20    1.1%  $150-400

  15   3.4%      $40-150

  17  6.2%      $80 -350

       0     ….

   52  0.8%  $210-2,000

Other

   39   2.1% $250-2,000

   4    0.9%     $600-600

  12  4.3%   $ 210 - 210

       0     ….

   55    0.9%   $30-2,000

TOTAL

1,897 100.0% $30-2,250

437 100.0%   $40-2,916

276 100.0% $ 70 – 2,000

3,787 100.0% $30-3,000

6,397 100.0% $30-3,000


TABLE 26:  NUMBER OF NATIONAL PERSONNEL EMPLOYED BY MONTHLY SALARY


Range of Monthly Salary

In US dollars

Number of National Personnel Employed

UN
Agencies
1

No. of
persons
        %

IFIs, ADB
& EC
a

No. of
persons         %

Bilateral
Donors
1

No. of
persons
       %

NGOs
a

No. of
persons 
      %

TOTAL
a

No. of
persons
       %

$0-100
$100-300
$300-500
$500-1,000
More than $ 1,000

     28         1.5%
1,521       81.8%
     78         4.2%
   193       10.4%
     39         2.1%

    44        10.1%
   288
       65.9%
     18         4.1%
     67       15.3%
     20         4.6%

    5           1.5%
   87         31.5%
   46         16.7%
 134         48.6%
    4           1.4%

   465        12.3%
1,901    
   50.2%
1,187   
    31.3%
   205         5.4%
    29          0.8%

   542        8.5%
3,797       59.7%
1,329       20.9%
   599        9.4%
     92        1.5%

TOTAL

1,859     100.0%

    437    100.0%

 276       100.0%

3,787     100.0%

6,359     100.0%


1   Excludes UNICEF that did not provide sufficient detail on salary levels. According to data provided all national personnel employed were paid between 227-2,558 US dollars per month.


| Content | Back | Top | Next |


Home | 8th CG Meeting | 7th CG Meeting | Partnership and Harmonization TWG | GDCC | Policy Documents Guidelines | Donor Dev. Coop. Pgm. | NGO