|
|
 |
 |
 |
||
|
|
|
|
|
|
|
||
|
|
|
50. Total disbursements of development assistance in 2001 increased from US$ 466.8 million in 2000 to nearly US$ 472 million in 2001 or by 1.1 percent. In 2001, as compared to 2000, development assistance provided by multi-lateral agencies increased by 5.6 percent and by bi-lateral donors 1.5 percent (Table 5). The disbursements by NGOs have, however, declined by 16 percent. 51. Of the total of around 472 million US dollars disbursed by the international community in 2001:
|
|
Total 1992 - 2001
|
|||||||||||||||||||||||||||||||||||||||||||||||||
|
|
|||||||||||||||||||||||||||||||||||||||||||||||||
|
Year 2001
|
|||||||||||||||||||||||||||||||||||||||||||||||||
|
|
|||||||||||||||||||||||||||||||||||||||||||||||||
|
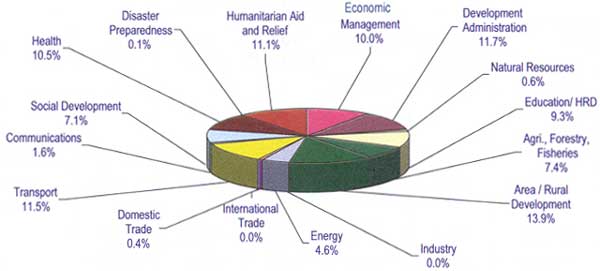
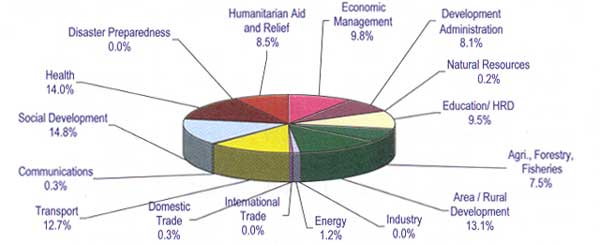
Disbursements by Sector and Year: 1999 - 2001
|
|||||||||||||||||||||||||||||||||||||||||||||||||
 |
|||||||||||||||||||||||||||||||||||||||||||||||||
|
Sector |
|||||||||||||||||||||||||||||||||||||||||||||||||
|
|
|||||||||||||||||||||||||||||||||||||||||||||||||
|
|||||||||||||||||||||||||||||||||||||||||||||||||
|
Table
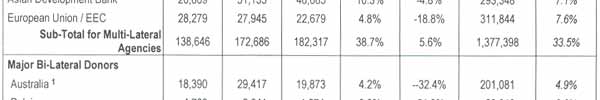
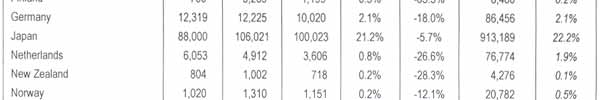
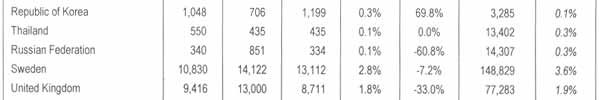
5: Disbursements by Major Donors |
       |
|
1 In early May 2002, AusAID informed CDC/CRDB that the detailed information it provided earlier has been misleading. AusAID’s new estimate for the years 1999, 2000, and 2001 (provisional) is US$ 19.24 million, US$ 19.76 million, and US$ 20.02 million, respectively. AusAID will be providing detailed data later to support the new aggregate numbers. The adjustments will be reflected in the Development Cooperation Report for the year 2002. 2 Estimates of total disbursements include UN agencies “Own Resources” only. “Own Resources” are funds that flow through Agency’s Headquarters to the Agency’s country office. |
|
Distribution
of Disbursements by Terms of Assistance Total 1992 - 2001 |
|
|
|
Year 2001 |
|
|
52.
Over the entire period from 1992 to 2001, the total of around 4.1
billion US dollars disbursed by the international community have included
contributions of:
53. The single largest donor of development assistance to Cambodia is Japan. Since 1992, Japan has provided over 22 percent of all external assistance received by Cambodia. In 2001, its contribution was just over 21 percent of total disbursements. UN System agencies have been the second largest provider of development assistance from their “own resources”, accounting for 9.2 percent of the total disbursements over the 1992-2001 period, and 8.7 percent of disbursements in 2001. In terms of percentages, the position of third largest contributors is shared by European Union and France, each provided 7.5 percent of total ODA over the entire period from 1992 to 2001. European Union’s contribution at US $ 311.4 million are slightly higher than France’s contribution of US $ 311.1 million. The next largest provider of development assistance to Cambodia is the United States of America. Its assistance constituted 7.3 percent of total disbursements over the 1992-2001 period, however, its share declined to 5.1 percent of total disbursements in 2001. The US assistance in recent years has been delivered through NGOs. Detailed data on disbursements by donor for each year from 1992 to 2001 is presented as Annex V. 54. The major donors who increased their assistance in 2001 as compared to 2000 included: France (US$ 36 million vs US$ 27.8 million), United States (US$ 23.8 million vs US$ 17.6 million), China (US$ 16.3 million vs 2.6 million), and Canada (US$ 5.2 million vs 0.8 million). |
|
|
|
Home |6th CG Meeting| Agenda | Contents| List of Participants | Position Paper | DCR | Partnership | Government | Donors | Download | Map | Photo |