|
Cambodia used the baseline survey on monitoring the Paris Declaration to
reinforce the H-A-R Action Plan and to begin the process of developing
national indicators and targets. This chapter builds on the discussion on
H-A-R monitoring presented in Chapter Three and considers the survey
exercise and the potential for the application of Paris Declaration
indicators to the H-A-R Action Plan.
In May 2006
the OECD/DAC launched the first round of Paris Declaration monitoring.
This section recounts the experience of conducting the survey in Cambodia
and derives some policy implications. It then describes the process by
which the Paris Declaration indicators will become an institutionalised
component of the H-A-R implementation and monitoring framework, which will
not only promote evidence-based aid management, it will also make future
monitoring exercises more routine and more accurate.
Reflections on the Paris
Declaration Monitoring Process
A
coordinating team that comprised both CDC and development partner
officials was established to support the monitoring exercise. This was no
small task but a spirit of cooperation and a common sense of purpose
ensured that Cambodia was able to locate this global work in a national
context. This required that many definitional issues be addressed so that
each partner could then report their own data with as much consistency as
possible.
|
Emerging Good Practices
Localising the Declaration
The need to localize some of the indicators based on
nationally-agreed definitions resulted in a good deal of
innovation.
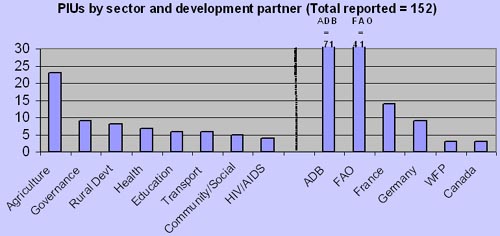
One notable output was a matrix that clarifies the nature and
status of PIUs. This matrix was considered a good practice by
the DAC and was posted on their website.
This work will be taken forward to develop a broader PIU
Strategy for Cambodia. |
|
It must be noted that this exercise proved to be very
time-consuming, underlining the need to institutionalise this work
if it is to be carried out efficiently in the future and then
effectively applied to national aid management efforts. In
particular, the following observations were made with regard to the
monitoring exercise and were reported to the DAC through Cambodia's
participation in the Working Party on Aid Effectiveness.
-
Many development partners do not have systems in
place to routinely monitor the indicators;
-
Defining important terms and criteria such as
coordinated technical cooperation, integrated PIUs,
Programme-Based Approaches and missions was sometimes problematic;
-
The "point of delivery" methodology does not
capture the extent to which some donors are channelling support
through others, overlooking an important indicator of
harmonisation;
-
Indicators 1 and 11, which are derived from a World
Bank desk study, benefited significantly from a stakeholder
discussion.
|
-
ODA
to Government (Indicator 3) is not always a useful measure of
alignment if support flows outside the Budget process (or is
unrecorded by Government) or is implemented by NGOs
-
The extent to which Indicator 4 proxies capacity
development was queried as the coordinated aspect may not be the
most critical determinant of effectiveness.
Results and Policy Implications
While
there may be some legitimate doubts regarding the integrity of the
data, the overall trends are felt to be representative of the
reality.
The results of the monitoring exercise are featured in the Cambodia
chapter of the OECD/DAC
Report on Paris
Declaration Monitoring Survey
publication, which was prepared in close consultation with the
National Coordinator for the monitoring exercise and local
development partners. |
|
Not Such Good Practices?
Reporting Consistency
Although guidance was provided, the survey
provided development partners with discretion in applying the
definitions. This resulted in coordinated technical
cooperation including arrangements in which development
partners coordinate amongst themselves, not with Government.
Similarly, attending a TWG was often thought to be sufficient
in order to consider a project coordinated
In its global overview of the survey process
the DAC noted the tendency to overstate progress and observed
that this may result in a spurious lack of progress once
better quality data is obtained in the future. |
|
The Baselines and Targets that resulted from this work are reproduced
below:
Table Seventeen.
Baselines and Targets
|
|
Indicators |
2005 Baseline |
2010 Target |
|
1 |
Ownership –
Operational PRS |
C |
B or A |
|
2a |
Quality of PFM
systems |
2.5 |
3.5 or higher |
|
2b |
Quality procurement
systems |
Not available |
Not applicable |
|
3 |
Aid reported on
budget |
79% |
90% |
|
4 |
Coordinated
capacity development |
36% |
50% |
|
5ai |
Use of country PFM
systems (aid flows) |
10% |
No target |
|
5aii |
Use of country PFM
systems (donors) |
44% of donors |
No target |
|
5bi |
Use of country
procurement systems (aid flows) |
6% |
Not applicable |
|
5bii |
Use of country
procurement systems (donors) |
28% of donors |
Not applicable |
|
6 |
Parallel PIUs |
49 |
16 |
|
7 |
In-year
predictability |
69% |
85% |
|
8 |
Untied aid |
86% |
More than 86% |
|
9 |
Use of programme-based
approaches |
24% |
66% |
|
10a |
Coordinated
missions |
26% |
50% |
|
10b |
Coordinated country
analytical work |
58% |
70% |
|
11 |
Sound performance
assessment framework |
C |
B or A |
|
12 |
Reviews of mutual
accountability |
Yes |
Target achieved |
Source: OECD/DAC Report on
Paris Declaration Monitoring Survey (Cambodia chapter), 2006
The main
policy related conclusions emerging from the monitoring exercise are
summarised as follows:
-
More
effective aid management requires significantly increased use of
Government planning, budgeting, execution and reporting systems. This
underlines the critical importance of the reform agenda;
-
There is a
need to synchronise development planning and budgeting, chiefly through
the PFM reform;
-
The very
limited use that is made of PBAs limits progress that can be made on
related issues such as predictable financing, reduced numbers of PIUs
and uncoordinated technical cooperation;
-
Only 14%
of ODA to Government was recorded as tied, suggesting that this need not
be viewed as a priority aid management issue in Cambodia.
|
Not
Such Good Practices?
Indicator 10 – a flawed methodology?
The
current methodology does not accurately record joint work as
the DAC has acknowledged.
For
Cambodia,
QD15 = 568 total missions, 147 listed as joint (QD16). This
came from a stock of 44 actual joint missions.
A
better way to calculate indicator 10a may be: 44 / (568 – 147
+ 44) = 9.4%. i.e. "Total incidents of joint missions / [Total
of all missions – joint missions (QD16 all partners) + total
incidents of joint missions]". The numerator is the real stock
of joint missions, the denominator the total stock of
missions, with double-counting accounted for.
The
DAC has introduced discounting as an alternative way of
addressing the double-counting problem. |
|
Institutionalising the monitoring exercise through
the
CDC Database & data audits
If the
Government and its development partners are going to make practical
use of the Paris Declaration then it must be fully institutionalised
in the national policy framework. A major step toward localising the
Declaration was taken in February 2006 when the Government approved
its H-A-R Action Plan and in the latter half of 2006 further
progress was made when the CDC Database was customised to routinely
record progress against those indicators that can be recorded at
project level (Indicators 4, 5, 6, 8, 9 and 10, see questionnaire in
Annex 3). Indicator 7 on predictability can also be derived using
aggregate projection and disbursement data provided by development
partners.
Incorporating data collection and analysis into the database has the
following advantages:
-
The monitoring exercise can be applied instantly to
national aid management work, providing a practical and workable
means of linking evidence to policy
-
Analysis can be undertaken on a sector basis to
identify priorities for aid effectiveness work at a disaggregated
level (see the box below and the Sector Profiles in Chapter 2, for
example)
|
-
There is an ability to monitor progress either by 'point of delivery'
partner or by the original donor source of funds
-
The on-line nature of the tool will allow for greater peer review and
validation of the information that is provided by development partners.
|
Emerging Good Practices
Developing Systems for Routine Monitoring and Reporting of the Paris
Declaration indicators
The
CDC Database has been customised to record many of the Paris
Declaration monitoring indicators. It also allows for point of
delivery (implementing partner) to be (de-)activated so that all
development partner funding (not just delivery) can be monitored
(including flows provided to the non-Government sector if desired).
The
advantage of this localized reporting, besides transparency,
efficiency and increased application to local aid management
efforts, is that individual development partners and/or sectors can
be analysed separately. This allows for each development partner or
sector to consider the areas in which they may prioritise progress
on aid effectiveness.
Development Partner Analysis
Individual analysis on each partner (subject to confirmation of data
integrity) might suggest, for example, that each development partner
might place a higher priority on a particular indicator (e.g. use of
PBAs for CIDA).
|
Indicator |
PD #4 |
PD #5a |
PD #5b |
PD #6 |
PD #8 |
PD #9 |
PD #10a |
PD #10b |
|
Coordinated TC |
PFM system |
Procurement system |
PIUs |
Untied aid |
PBA |
Joint missions |
Joint work |
|
Canada |
18.5% |
0 |
0 |
3/25 |
31.4% |
0.3% |
0/18 |
0/5 |
|
UNFPA |
61.8% |
54.2% |
54.2% |
3/28 |
0% |
63.5% |
1/9 |
0/0 |
Sector Analysis
Analysis across sectors highlights the relative priorities of health
and transportation. In health, where a PBA is more established, more
emphasis might be placed on joint missions, joint analytical work
and more use of the PBA modality. For the transportation sector,
more aid is tied, technical cooperation is uncoordinated and little
use is made of Government systems.
|
Indicator |
PD #4 |
PD #5a |
PD #5b |
PD #6 |
PD #8 |
PD #9 |
PD #10a |
PD #10b |
|
Coordinated TC |
PFM system |
Procurement system |
PIUs |
Untied aid |
PBA |
Joint missions |
Joint work |
|
Health |
53% |
35% |
43% |
7 |
56% |
24% |
6/25 |
3/27 |
|
Transportation |
0% |
17% |
26% |
6 |
20% |
12% |
0/7 |
2/2 |
PD #6
indicates number of partially integrated PIUs and total number of
projects
PD #8
indicates share of aid that is fully untied
PD #9
indicates disbursements on projects associated with a PBA
Further analysis of both sectors and development partners can be
undertaken on specific indicators. Analysis of Indicator 6 on PIU
integration, for example, shows that this may be an issue that some
development partners and sectors wish to focus on, while for others
it may not be a priority issue.
NOTE:
The analysis presented in the chart above must be interpreted with
caution. Much of the data is felt to be in need of validation. It is
useful, however, to highlight the potential of this
locally-developed technology so that this will encourage
policy-relevant analysis to be made available in the future. |
-
Routine
monitoring makes the whole exercise much more efficient; reports can be
instantly produced for national monitoring purposes or for reporting to
the OECD/DAC.
-
The data
collection exercise in early 2007 provided an opportunity to test the
Paris Declaration monitoring functions of the CDC Database. The
technology proved to be highly effective and an algorithm was designed
so that project reporting could be aggregated to derive a set of
indicators at either the development partner or sector level.
-
These
indicators can now therefore be applied to the H-A-R Action Plan, with
TWGs being asked to identify the indicators that are most relevant to
them, together with appropriate targets.
While the
system performed extremely well the actual data quality revealed that
there is still a somewhat limited understanding of the Paris Declaration
amongst many development partners. In many cases data fields were
incorrectly filled or, in most cases, simply left blank, although many
development partners were able to provide information that allows at least
some results to be derived.
|
The overall concern of data quality, however, does raise question
marks with regard to the DAC survey that was completed only six
months earlier: if partners are unable to define, identify and
measure coordinated technical cooperation on a project level in
January 2007, for example, it is not clear how were they able to
provide an aggregate figure in June 2006.
Indicator 10 provides additional grounds for caution in interpreting
the 2006 data; the 2007 exercise highlighted that few development
partners are able to record how many missions took place or the
number of analytical pieces that were commissioned. The prospect of
moving toward the use of joint missions as part of the transition
towards PBAs is some way off. One alternative is to innovate in the
manner in which these indicators are collected. Indicator 10a, for
example, might be more easily recorded by monitoring the Head of
Cooperation's diary to see which missions pass through the local
office. For missions from headquarters a more coherent approach in
donor capitals, possibly utilising the offices that coordinate
travel arrangements, could report more routinely on mission activity
from capitals and headquarters. |
|
Emerging Good Practices
Institutionalised Monitoring
The Agriculture and Water TWG has established a website (www.twgaw.org)
that includes information on its activities, including
missions and analytical work.
The European Commission in Cambodia has indicated that it
might be interested in using the CDC Database format for
recording PD indicator 10a/b to develop their own system for
recording missions and analytical work.
In both cases missions and analytical work will then be
routinely recorded and up-loaded, including forward-looking
schedules that will promote collaboration. |
|
During the process of revising the analysis in this Report it was also
noted that several development partners had significantly revised their
Paris Declaration indicators. The motive or rationale for this significant
revision after reviewing the first set of results is not clear
but
the overall experience of institutionalising the Paris Declaration
monitoring exercise suggests that a dedicated data validation exercise
with each development partner is required. This will build the
understanding and provide the information that is required to monitor the
Paris Declaration and then ensure that the evidence that is derived for
policy-making purposes is accurate. It is therefore proposed that 'Paris
Declaration audits' that adopt a 'learning by doing' approach be developed
in the latter half of 2007.
Additional Indicators
While the
Paris Declaration indicators can be applied to the Cambodia context, and
the associated targets can be internalised into the H-A-R Action Plan, it
is also necessary to keep in mind the need to develop indicators that
reflect local priorities. In this regard, the Government proposes these
additions:
|
Emerging Good Practices
Alignment with national priorities
Indicator 3 shows that 79% of aid flows to Government were
recorded on the Budget, which is the Government's main tool
for allocating and expending resources on national priority
programmes, including those in the NSDP. The analysis in
Chapter Two also shows that significant progress has been made
at an aggregate level in aligning aid flows with the NSDP. |
|
-
First, the indicators
will
be tracked by sector, as well as by development partner (point of
delivery). This will allow for relative priorities to be
identified within TWGs as opposed to being set centrally;
-
Second, an additional indicator will be established
to monitor, at an aggregate level, how much development assistance
is being disbursed through other partners. This indicator, which
can also be monitored at sector level, will record the number of
partnership agreements as well as the fund flow.
-
In accordance with the H-A-R Action Plan, data
provision by development partners will be undertaken more
rigorously as part of the commitment to mutual accountability,
including to hold data validation exercises with each development
partner (and TWG, where requested).
|
The CDC
Database allows for the routine monitoring of indicators that can be
readily adapted and applied to the H-A-R Action Plan. This includes the
ability to report on a sector-by-sector basis that will permit the
decentralised identification of indicators and targets by TWGs (see, for
example the four sector profiles in Chapter Two that present
sector-specific Paris Declaration assessments). While it may therefore be
felt by some practitioners that there may be a weak link between some of
these indicators and aid effectiveness, the technology that has been
locally developed provides the capacity to select those that are relevant.
The most
immediate challenge that lies ahead relates to the ability to collect
accurate information on each of the indicators. Regardless of the explicit
link between the indicators, aid effectiveness and results, it is the
Government's view that many of the indicators represent actions that will
in any case lead to more effective business practices (e.g. joint
missions, joint analysis) and therefore it acknowledges the utility of
promoting and monitoring progress in each of them.
|
Content
| Back |
Top |
Next | |