|
|
 |
 |
 |
||
|
|
|
|
|
|
|
||
|
|
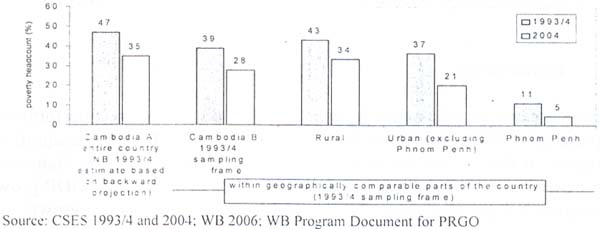
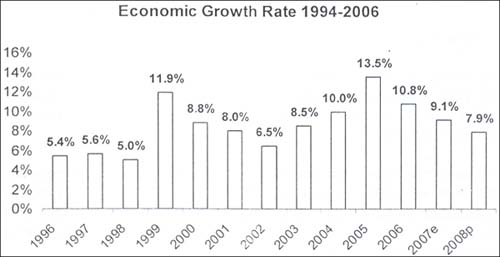
CAMBODIA: RECENT ECONOMIC DEVELOPMENTS1 1. Introduction This paper outlines the major aspects of Cambodia's economic performance, especially in 2006. During the last decade, Cambodia has made a significant progress in developing its economy. A sound macroeconomic framework has helped underpin success in recent years, with Cambodia's GDP growth averaging 8.4 percent over the period 1994-2006. Economic growth was more robust recently, at the average rate of 9.8 per cent for the period of 1999 to 2006, 11.4 per cent in the last three years, and reaching 13.5 per cent in 2005, and 10.8 per cent in 2006. The growth was mainly driven by garment industry, tourism sector and construction activities along with significant contribution from agriculture. Overall, economic growth over the last decade has raised living standards and reduced poverty headcounts. When comparing living standards within the same geographical frame in 2004 and 1993/4, average per capita household consumption is found to have risen 32% in real terms (to 2,932 riels per day in 2004). In Phnom Penh and other urban centers the rise has been considerably more dramatic. Thus, the decline in poverty has been significant and widespread. As average per capita consumption has risen, many more households now have per capita consumption values above the poverty line, resulting in falling poverty headcounts. Within the geographical sampling frame of the first survey, the headcount fell from 39 to 28 percent. Backward projection on the basis of this observed trend suggests that the national poverty rate fell by 10-15 percentage points over the last decade (from a projected 45-50 percent in 1993/4 to a measured 35 percent in 2004). Moreover, poverty is very likely to have fallen further in 2005 and 2006 due to the exceptionally high growth rates of those years, especially in agriculture. Projections put the poverty rate at about 32.5 percent in 2006.
Figure 1. Poverty has fallen in rural as
well as urban areas
At the same time, inequality in Cambodia has increased over the last decade. The Gini coefficient for per capita household consumption rose from 0.35 to 0.40. Inequality has been increasing during the years in several dimensions — between rich and poor; different regions; and urban and rural areas and also within the rural areas. The average living standard of the richest fifth of Cambodians in 2004 was 45% higher than it was a decade ago; but living standards for the poorest fifth had gone up by only 8%. In addition, Cambodia has experienced regional differences in poverty reduction and urban-rural gap wideness. Poverty has fallen at much faster rate in urban areas such as Phnom Penh and costal provinces than in other regions of Cambodia. En some remote and mountainous areas poverty incidence has even increased. 2. Economic performance in 2006 After climbing to an all time record of 13.5 per cent in 2005, growth of real GDP slowed to 10.8 per cent in 2006 in line with projections. Economic performance in 2006 though somewhat diminished compared with 2005 was still impressive since a double digit growth was achieved on top of the stellar performance of the previous year. This underscored the increasing resiliency of the economy and showed that the performance in 2005 was neither a stray outcome nor a mere statistical artifact. Important contributions for the strong economic performance in 2006 carne from steady growth in agriculture (5.5 per cent), sustained growth of tourism receipts (13.2 per cent), the continued growth in garment exports (20.4 per cent) and the robust expansion of construction activities (20.0 per cent). Fiscal policy continued to be prudent in 2006. While the current budget surplus increased to 1.2 per cent of GDP, the overall budget deficit declined to -3.3 per cent of GDP2 reflecting ongoing budget consolidation. Figure 2. Economic Growth in 1994-2006
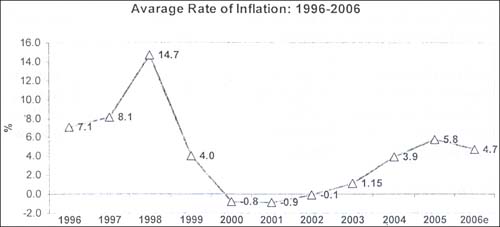
Monetary developments in 2006 reflected the improvement in external position. Domestic credit rose by 35.6 per cent while M2 increased by 38 per cent. The key objectives of monetary policy were maintaining price stability and bolstering international reserves. These were substantially achieved. Inflation was contained to an estimated 4.7 per cent. Gross international reserves increased by 31 per cent to US$1.1 billion, sufficient for 3 months of imports in 2006. The deficit in the current account of the balance of payments declined from -9.4 per cent of GDP in 2005 to -7.2 per cent in 2006. However, overall balance of payments continued to register a surplus mainly due to the strong inflow of capital receipts. 3. Sector performance in 2006 Two key features of economic performance in recent years are the increasing diversity of the sectors contributing to economic growth and the robust contribution of the agriculture sector to economic growth. Real GDP growth has averaged 10.4 per cent during 2003-2006. The Royal Government of Cambodia has moved strongly to support agriculture and the garment sector. However growth has not been centered only on these two sectors. Tourism and construction are also emerging as important growth centers in the economy. Overall recent economic performance has been characterized by balanced contributions from agriculture manufacturing, construction and services. This was clearly evident in 2006. 3.1. Agriculture3 After strong growth in 2005 (15.7%) agriculture grew by 5.5 per cent in 2006. Rice production increased by 4.6%, mainly due to measures taken by the RGC to build irrigation facilities and pumping stations for increasing the area under irrigation. Livestock grew by 8.2 per cent in 2006. Fisheries grew by 3.8 per cent in 2006, compared with 5.6 per cent in 2005. The performance of fisheries is disappointing since the government has put considerable emphasis on the revival of this key sub sector which provides livelihoods for the poor and marginal sections of society. 3.2. Industry Industry’s growth continued to be commendable at 18.3 per cent. The key contribution came from the exports of textiles and garments (growth of 21.5 per cent). The textile and garment sub sector, which accounts for nearly half of the value added of the industrial sector, led this spurt, with a growth rate of 20.4 per cent. The number of garment factories increased by 53 to 398 and the number of garment Markers by 19 per cent to 333,144. In order to reduce the costs of doing business, the RGC has exempted the garment industry lam the corporate tax. The tax foregone amounts to US$100 million per annum. As a further incentive to this industry, the government has decided to reduce the export management fee by 10 per cent in 2007. The mining sub sector grew by 15.9 per cent. The major activities contributing to this growth were the exploration of oil and gas in the Gulf of Thailand and the establishment of an. iron ore extracting company in Preah Vihear Province, in the northeastern part of Cambodia. Construction grew by 20.0 per cent. In particular, construction activities in Phnom Penh and Siem Reap accelerated sharply. New township projects and the planned construction of two bridges across the Tonle Sap River in Phnom Penh, as well as the establishment of Special Economic Zones would give a strong boost to construction. 3.3. The Services Sector Services grew by 10.3 per cent in 2006, compared with 12.7 per cent in 2005. All the sub sectors of services have shown robust growth. The expansion of the tourism and hotel industry continued, with a growth rate of 23.3 per cent. In 2006, a total of 1.7 million tourists visited Cambodia. The target is to attract at least 2 million tourists in 2007. The RGC has put emphasis on strengthening the linkages between tourism and rural development in order for the poor to benefit from the expansion of tourism. The RGC intends to transform the entire Siem Reap region into a green belt so that strong backward linkages of tourism with agriculture could be established. The transport and communication sub sector grew moderately by 4.3 per cent. Alter completing the rehabilitation and reconstruction of the national road network, the RGC has turned its attention to the rebuilding of provincial and rural road infrastructure in order to bring the rural areas of Cambodia into the mainstream of the economy. The telecommunications sub sector showed a robust growth, especially the market of mobile phone services. However, the telephone tariffs in Cambodia are high and discourage a rapid growth of telecommunications. The financial sector grew by 24.0 per cent. Real estate increased by 10.9 per cent reflecting the surge in private sector construction. Trade grew moderately by 6.8 per cent. 4. Inflation Figure 3. Average Inflation Rates in 1996-2006
Inflation slowed down from 5.8 per cent in 2005 to 4.7 per cent in 2006, helped by the bearish oil prices. Rapid increase in money in circulation and the hike in food prices, especially rice, contributed to the moderate inflation. 5. Exchange Rate Prudent monetary and fiscal policies of the RGC helped moderate inflation and maintain a stable exchange rate. In 2006, the riel depreciated by 2 per cent against the US dollar in nominal terms. In real effective terms the riel depreciated by 0.3 per cent over 2005. 6. Monetary Developments 6.1. Financial Sector Development Strategy 2006-2015 Financial sector reform is guided by the ten-year sector blueprint "Vision and Financial Sector Development Plan Jar 2001-2010", which was adopted by the Royal Government of Cambodia on the 24th August 2001. The blueprint envisages the development of a sound, market-based financial system in ten gars that will enhance resource mobilization and sustainable economic growth.
The blueprint was updated with the technical
assistance of the ADS and on 7 June 2007, the Prime Minister launched the
"Financial Sector Development Strategy 2006-2015", which
will guide the financial sector reform in the next 10 In promoting integration and soundness of our financial system, the RGC is committed in policy shift towards openness and integration with the region and the rest of the world. In this context, the following key characteristics in pursuing economic and financial policy strategy towards deepening integration and strengthening financial system should be emphasized:
6.2. Monetary Performance in 2006 Similarly, the financial sector saw some improvement in 2006, though vulnerabilities remained. Combined deposits (deposits in del and foreign currency) of banks operating in Cambodia rose by 43 percent and the lending-to-deposit ratio has continued to trend upward, reaching 68 percent in 2006 (from 64 percent in 2005), reflecting growing business activities in 2006 (business registration grew by nearly 50 percent over 2005, for example). There are now 20 banks operating in Cambodia, an increase from 18 banks in the end of 2005. Sectoral vulnerability, however, stems from the joint ownership of two of the largest banks, both of which have balance sheet and management weaknesses. Cambodia also remains a highly dollarized economy with nearly 75 percent of broad money and 97 percent of the banking deposits made in US dollars. 95 percent of the banking transactions were in US dollars. The commercial interest rate is still high at around 16.3 percent per annum. The key monetary developments during 2006 included the following:
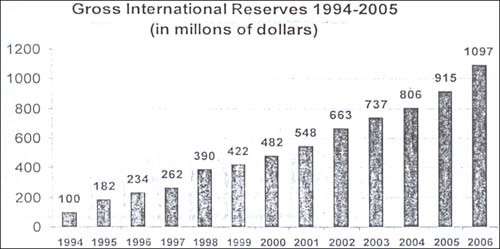
The growth in domestic credit was mainly due to expansion of credit to the private sector. The substantial expansion in liquidity reflected the healthy improvement in Cambodia's external position. The liquidity expansion supported the high growth of GDP and further contributed to financial deepening. A more detailed outline of these developments is given below. 6.2.1. Gross International Reserves The net foreign assets of the banking system increased by 38 percent from US$1.3 billion in December 2005 to US$1.8 billion in December 2006. The gross international reserves increased from US$915 million in December 2005 to USS1.1 billion in December 2006, due to good export performance and the increase in foreign direct investments. Figure 4. Gross International Reserves
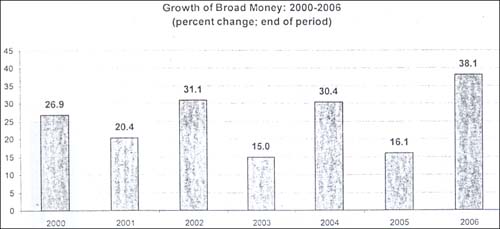
Domestic credit increased by 35.6 percent from US$479 million in December 2005 to USS$659 million in December 2006, due to improvement in the net claims on government and credits to the economy. 6.2.2. Net Claims on Government The net claims on government improved from —US$102 million in December 2005 to —US$335 million in December 2006. The US$233 million reduction was mainly clue to a 66 per cent increase in government deposits, while government debts to the banking system declined by 12 per cent. 6.2.3. Credits to the Economy Credits to the private sector increased by 51.5 per cent from US$581 million in December 2005 to USS893 million in 2006 mainly for financing trade and investment. 6.2.4. Liquidity Liquidity increased by 38 per cent from USS1.2 billion in 2005 to US$1.7 billion in 2006, due to the growth in foreign currency deposits and money in circulation (by 14 per cent). Figure 5. Growth of Board Money
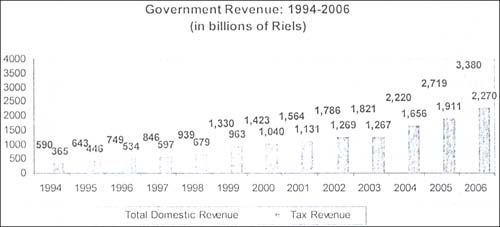
6.2.5. Deposits Deposits with the banking system increased by 45 per cent from US$909 million in December 2005 to US$1.3 billion in December 2006. These deposits are categorized as foreign currency deposits - US$1.28 billion (96 per cent); term deposits - USS 22 million and demand deposits — US$14 million. The above distribution of deposits reflects the continuing dollarization of the economy. 6.2.6. Money in Circulation Money in circulation increased by 24 per cent from 1.2 billion riels in 2005 to 1.6 billion of riels in 2006 to keep pace with the increase in economic activities. 7. Public Financial Management The Ministry of Economy and Finance (MEF), together with its development partners, has established a best practice performance management Framework for the Public Financial Management Reform Program (PFM). The PEM reform was launched by the Prime Minister in December 2004 and now is yielding major achievements in its first two years of implementation. The PFM reform program is intended to mobilize higher resource levels and improve the management of public resources, both of which should result in a higher quantity and quality of pro-growth, pro-poor service delivery. Greater revenue will allow higher levels of expenditure in both the neglected economic sectors—transportation, agriculture, irrigation, and energy—as well as in the social sectors, which have benefited from significant increases in funding over the past years. Improvements in PFM systems will also allow for more efficient and effective spending, generating higher rates of return on investment projects and greater impact in terms of the efficiency of service delivery. Major reforms measures commenced implementation in January 2007, including: a significant streamlining of budget execution procedures, the introduction of program budgeting, and adoption of a new chart of accounts. These follow on significant reforms in 2005: the amount of customs revenue collected through the banking system increased (from zero in 2004 to nearly 1/3 in 2006); more than ¾ of all Tax Department revenue is now collected through the banking system; about ¾ of Treasury payments to suppliers in Phnom Penh and Sihanoukville are now made by check instead of cash; the stock of old expenditure arrears has been reduced by over 40 percent; the procurement process has been streamlined, tightened, and made more competitive with the passing of a new sub-decree in late 2006; the Government has set up internal audit departments in a dozen line ministries, and, for the first time in Cambodia, a pilot program has been launched to pay civil servants through commercial banks instead of by cash. As a result of the PFM reform, fiscal consolidation continued to progress in 2006. Revenue collection improved substantially while expenditure was tightly managed, as outlined below. 7.1. Revenues Figure 6. Government Revenue Collection
Domestic revenue has almost doubled during the last five pears, between 2002 and 2006, almost tripled during the last eight pears, between 1999 and 2006, and has quadrupled during the last decade. Domestic revenue increased by 26 per cent from US$660 million in 2005 to US$832 million in 2006 (11.5 per cent of GDP). This 26 per cent increase was mainly clue to the growth in tax revenue, which rose from US$464 million in 2005 to US$559 million in 2006. Revenue collected by the Direct Taxes Department increased by 38 per cent to US$189 million, while the revenue collected by the Customs and Excise Department increased by 11 per cent to US$370 million. Non-tax revenue increased by 9 per cent from US$137 million to US$150 million in 2006. 7.2. Expenditure Rising incomes and gradual improvements in service delivery have started to result in improved human development indicators. In many areas Cambodia's human development indicators are lagging other countries in the region. Table 1. Government and Externally Financed Expenditure by Summary Function, 1996-2003 (% GDF)
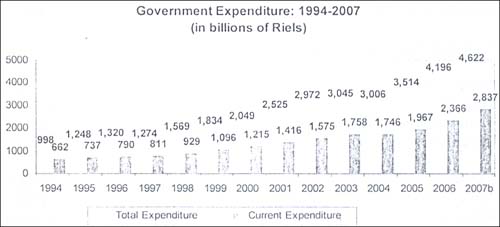
However, the health and education ministries have progressed further than most in developing sector-wide strategies; aligning policy, planning, budgeting and monitoring and evaluation processes toward these strategies; and gradually reorienting priorities in a pro-poor direction. These fundamental improvements in core systems are starting to result in improved outcomes. Increases in social spending in recent years seem to have resulted in positive trends in education and health outcomes. Development of sector strategies and matching systems for planning, budgeting and M&E have provided a framework within which investments in physical infrastructure (schools and clinics) and increasing numbers and to some degree quality of front-line service delivery staff (teachers, doctors and nurses) have started to shift a number of human development indicators upward. Primary enrollment has increased significantly. Net primary enrollment rates improved and net lower secondary enrollment rates also increased. Similarly in health, there has been remarkable success in controlling and then reducing the spread of HIV and apparent significant decline in infant and under-five mortality rates. The RGC has committed toward increasing expenditure in the following priority areas: roads, irrigation, agriculture productivity, education, and health. Revenue is projected to increase gradually from 11.5 percent of GDP in 2006, opening up fiscal space for higher expenditures in agriculture, irrigation, roads, and energy, as well as growth in social sector spending. The Government has indicated its intention to significantly increase spending on rural infrastructure, and is beginning by allocating a large share of the IMF Medium Term Debt Relief Initiative (MDRI) funds (USS 33 million) to fund small rural irrigation projects in eastern provinces thorn 2006-2008. Figure 7. Government Expenditure
Total expenditure has doubled during the last eight years, between 1999 and 2006, and has tripled during the last decade. Total expenditure increased by 12.4 per cent from US$853 million in 2005 to US$959 million in 2006. 7.2.1. Current expenditure Current expenditure increased to US$584 million (8 per cent of GDP). The payroll expenditure increased from US$173 million in 2005 to US$173 million in 2006. The payroll accounted for 34 per cent of current expenditure (2.8 per cent of GDP). Budget execution has very much been improved in 2006, due to the implementation of the PFM reform program, reflecting improvement in budget disbursement and good budget preparation. Budget execution for the priority ministries was broadly good. Current expenditure disbursement for the Ministry of Health was 100 per cent; the Ministry of Education, Youth and Sport was 100.8 per cent; the Ministry of Agriculture, Forestry and Fisheries was 98.5%; the Ministry of Rural Development was 90.4 per cent; the Ministry of Water Resources and Meteorology was 93 per cent; the Ministry of Public Works and Transport was 93.8 per cent; the Ministry of Women Affairs was 97.6 per cent This does not include capital spending of the MPWT, MRD and MOWRAM. Budget disbursement for the Ministry of Economy and Finance was 60.8 billion riels or 156.5 per cent of the approved budget, including the spending on road maintenance, which initially approved separately in the budget. Disbursement to the Ministry of Industry, Mine and Energy was 339 per cent, due to the incorporation of VAT refund for the garment factories. 7.2.2. Capital expenditure Capital expenditure is divided into two components: locally financed expenditure, i.e. financed by domestic revenue and externally financed capital expenditure. i.e. expenditure financed by bilateral and multilateral development partners in the form of grants and concessional loans. Capital expenditure increased to US$418.4 million (5.8 per cent of GDP) in 2006. Externally financed capital expenditure amounted to US$326.4 million (4.6 per cent of GDP). The externally financed capital expenditure is incorporated ex post into the budget. It is disbursed directly by the development partners.
Table 2. Government capital expenditure by
type
The disbursement of government capital expenditure was maintained on average around 200 billion Riels or US$50 million. The capital spending concentrated on only three ministries: the Ministry of Public Works and Transport (35 billion Riels), the Ministry of Water Resources and Meteorology (38 billion Riels) and the Ministry of Rural Development (25 billion Riels).
Figure 8. Share of Government Capital
Expenditure in 2006
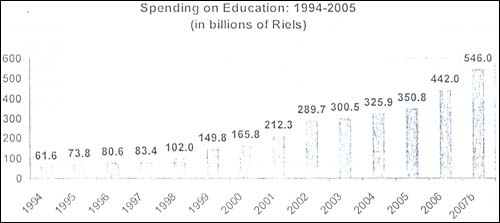
The current budget surplus amounted to 1.2 per cent of GDP in 2006. The overall budget deficit declined to -3.3 per cent of GDP. The overall budget deficit was financed by concessionary loans and grants provided by Cambodia's development partners. The fiscal strategy of Cambodia does not allow domestic financing of the Fiscal deficit. 7.2.3. Expenditure by sectors 7.2.3.1. Education Spending During the last decade, starting Gum 1998 to 2007, spending on education has increased more than live tinges in nominal terms, From 102 billion to 546 billion CRs ($134 million) respectively. Figure 8. Education Spending
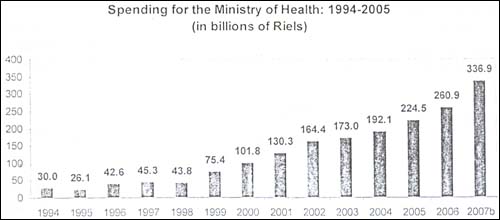
Starting from a low base, the Cambodian education system has made some impressive gains. Estimated net enrolment rates at the primary level are up significantly from 65% in 2000 to 76% in 2004 (CSES). Lower Secondary (grades 7-9) net enrollment has more than doubled since 1997, increasing from 7.6% to 16.4%. Advances in important indicators such as literacy, repetition rates and years of schooling for younger age cohorts are further positive signs that the rebuilding of the national education system is taking root. Progress has also tended to be pro-poor. While socioeconomic, rural and gender gaps in educational attainment exist, these gaps have generally been reduced significantly in recent years, particularly at the primary level. 7.2.3.2. Health Spending During the last decade, health spending rose from more than seven bids from 44 billion CRs in 1998 to 337 billion CRs ($82 million) in 2007. Figure 9. Health Spending
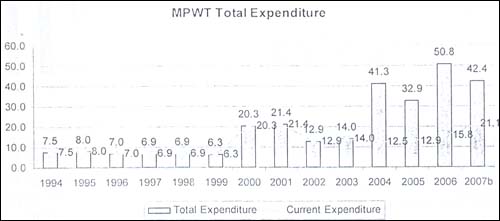
Recently released data suggests progress on a number of health indicators, reflecting rising average levels of consumption and falling poverty rates recorded last year from the household living standards survey. Findings from the 2005 Cambodia Demographic and Health Survey (CDHS) suggest significant progress on a number of output and outcome measures relative to the previous (2000) CDHS. Health service delivery has improved in a number of critical respects (notably rates of childhood immunization and the percentage of births attended by a trained professional). Health practices are also changing, with a dramatic rise in exclusive breastfeeding of children aged under six months. These improvements in service delivery and utilization are feeding through into a number or health outcomes, with falling fertility rates. better (though still extremely poor) childhood nutrition, and significant improvements in childhood survival (with infant mortality rates falling from 95 to 65 per 100,000 live births, and under-five mortality lulling From 124 to 83). Maternal mortality (per 100,000 live births) has also decreased, from over 437 in 2000 to 343 in 2005. While births at home are slowly giving ways to births at a facility (up from 32% to 44%), progress is starting Mom an extremely low base, and there is a long way to go. Although Cambodia has still the highest prevalence of HIV/AIDS in the region, it has been successful in arresting and reversing the growth of epidemic (the estimated prevalence rate for the percentage of adults aged 15-49 years fell from 3.0 in 1997 to 1.9 in 2003). Similarly, the TB epidemic has shown a declining trend. 7.2.3.4. Spending on Road Infrastructure The Government's Rectangular Strategy places great importance on the rehabilitation of the country's existing infrastructure and the construction of new infrastructure assets to meet the demand of its growing economy. The road sector continues to be a high priority. Figure 10. MPWT Total Expenditure
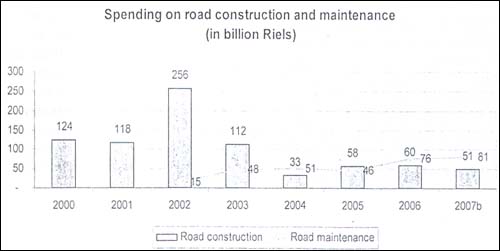
Research found out that decreasing the distance from the village clue to good road by one kilometer will enhance productivity by about 30 thousand Riel per hectare. Land with access to irrigation facilities during the dry season has 15 percent greater rental value and 10 percent higher sale value than land without irrigation. Figure 11. Spending on Road Construction and Maintenance
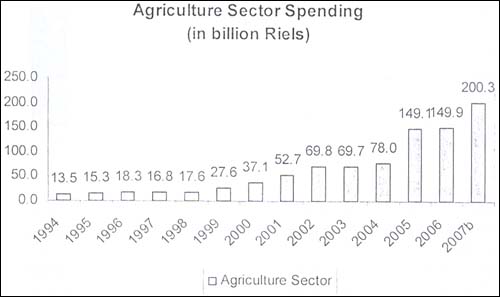
From 2000-2006 the disbursement for road construction amounted to about 1,130 billion riels or US$283 million. Spending on road construction peaked in 2002, then began to decline from 2003 onward. The RGC has scaled up maintenance expenditures on its road network by increasing its volume and by 2004 road maintenance spending began to exceed road construction spending. However, maintenance spending remains low compared to needs which cover all government road assets (including those financed by the development partners), resulting in a deterioration of the capital stock beyond normal depreciation. The RGC has also stressed the need to continue to expand funding or health and education, and would allocate PRGO Rinds toward those sectors. 7.2.3.5. Spending on the Agriculture Sector Government current spending on agriculture (Ministry of Agriculture, Forestry and Fisheries, the Ministry of Rural Development and the Ministry of Water Resources and Meteorology) has doubled from 52.7 billion Riels in 2001 to 118.6 billion Riels in 2007. This spending has tripled since 2000. However, this figure does not include capital spending, which was mainly for the construction of rural roads and irrigation facilities. Figure 12. Total Government Spending on Agriculture
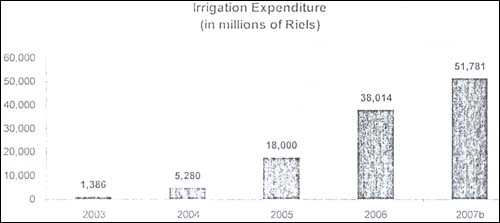
Total government spending on agricultural sector (both current and capital expenditure) increased by more than 10 folds during the last decade from 18.6 billion rids in 1997 to 200 billion riels (or US$50 million) in 2007. Agricultural performance is volatile and yields are strongly correlated with weather conditions. The growth rate of agriculture averaged 3.3% per annum during 1994 -2004. The average rice yield has increased gradually every year from 1.5 tons per ha in 1993 to about 2.5 tons per ha in 2005. The use of high-yielding seeds supplied by the fledgling seed companies, improved disease and pest control, good weather conditions, the initiatives of the government to provide irrigation facilities For dry paddy lamming and the increasing popularity of the rice intensification scheme (RIS) have been the main reasons for this performance. However, in absolute terms productivity is low and far behind other major agricultural producers and exporters in the region. There is high potential for significant increase in agricultural incomes through effectively directed investment, and proactive and progressive policies learning from the experiences of neighboring countries. Figure 13. Government Irrigation Expenditure
Government investment in irrigation increased by annual average of 7% during 2003-2007 and reached about 51.7 billion Riels or US$12.6 million in 2006. Irrigation investment is not attractive due to its low financial returns even though economic returns may he higher. Prom social perspective irrigation investment would not benefit much the landless poor, households which are nearly landless and farmers practicing rain-led framing or located in the tail end of the water distribution systems. However, commercially oriented farmers might benefit from crop diversification made possible by assured irrigation. A recent sample survey found that less than 20% of the irrigation systems had a strong organization for water management and maintenance, which resulted in substantial capacity under utilization. The survey concluded that pumping stations are more efficient in delivering irrigation in Cambodia. The potential conflicts between upstream and downstream users of water in gravity-fed irrigation systems are avoided in the pumping based irrigation systems. Irrigation using mobile pumping sets is becoming increasingly popular in Cambodia or saving the rice crop from drought. High yielding seeds and correctly applied fertilizers and pesticides in combination with carefully managed irrigation increase crop yields and financial returns. Cambodian farmers, particularly those practicing subsistence agriculture, tend to use their own seeds despite the poor germination rate. Even though farmers pay for the high quality seeds supplied by the seed producing lions, the crop yields triple with their use. 7.2.4. Merit Based Pay Initiative However, the fundamental underlying impediments to further improvement in service delivery and outcomes are inadequate systems for managing public finances and public sector human resources. The second fundamental and related cross-cutting weakness that holds back improvements in service delivery is public sector human resource management, and particularly the inadequate level of remuneration for civil servants. The salary of public sector employees at all levels—including those (such as teachers and health center stall) who are directly responsible for the delivery of basic services to the population--is not enough to live on, resulting in absenteeism, the levying of additional, informal fees which bias against the poor, and low job motivation. To address the above problem, under the PFM reform, the MEF piloted since June 2005 a Merit-Based Pay Initiative (MBPI), which helps to identify approaches to systematically raise salaries in such a way as to reward ability and job performance. Since then, the key officials of the Ministry of Economy and Finance responsible for PFM reform program, especially departmental action plan have benefited the MBPI as incentives in addition to their basic government salary. To systematically address all concerns and ensure the effectiveness and efficiency of the implementation of MBPI, the MEF has prepared a second phased MBPI implementation strategy by proposing to upgrade the Muff Sub-committee with the following responsibilities:
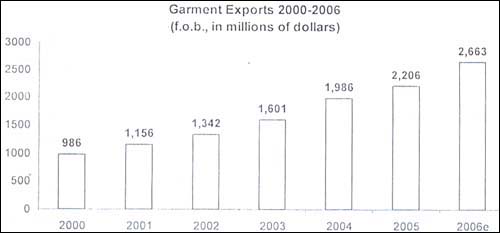
8. Foreign Trade and the Balance of Payments The main developments in the external sector in 2006 were the shrinking size of the current account deficit as a proportion of GDP, increase in the influx of foreign aid and foreign direct investments (PDI), and the increase in foreign currency deposits of commercial banks with the National Bank of Cambodia. Official transfers increased mainly clue growth of current transfers in the form of grants. As a result Or these Favorable external sector developments the overall balance of payments and the gross international reserves continued to improve in 2006. 8.1. Exports and Imports Exports increased by 27.5 per cent from US$2.9 billion in 2005 to US$3.7 billion in 2006, due to continued surge of textile and garments exports. Garment exports increased by 18.2 per cent from (US$2.2 billion in 7005 to US$2.6 billion in 2006. Garment exports account for nearly 70 per cent of Cambodia's total exports. The US remained the top export market, accounting for 70 per cent of Cambodia's total exports, followed by the European Union — 21 per cent and Canada — 4 per cent. Re-exports were estimated at US$133 million. Figure 14. Garment Exports
Total imports increased by 20.5 per cent Bunt US$3.9 billion in 2005 to US$4.7 billion in 2006, mainly due to the growth in the imports of petroleum products (31.9 per cent) and intermediate products for the production of garments (18.2 per cent). 8.2. Trade Balance Cambodia's trade deficit in 2006 remained at the same level as in 2005, at about USS 1 billion, as an increase in imports of US$799 million was offset by almost the same amount of increase in exports of US$783 million. 8.3. The Balance of Services anal Revenues Services and revenues account increased by 30.4 per cent from US$217 million in 2005 to US$283 million in 2006. Net services were estimated at US$506 million in 2006, compared with US$471 million in 2005. This increase was mainly due to the growth in tourism receipts (US$963 million). The net current transfers were estimated at US$694 million in 2006, compared with US$535 million in 2005, an increase of US$159 million as a result of the growth of both official and private transfers. 8.4. Current Account The current account deficit declined from 4.3 per cent of GDP in 2005 to 2.9 per cent of GDP in 2006. Excluding official transfers, the current account deficit decreased from 9.4 per cent of GDP to 7.2 per cent. 8.5. Capital Account The capital account and Financial transactions balance increased by US$69 million from US$330 million in 2005 to US$339 million in 2006. The capital transfers in the form of medium and long term loans declined by US$17 million from US$138 million in 2005 to US$121 million in 2006. The influx of private capital in the form of FDI increased from US$375 million in 2005 to US$475 million in 2006. The increase in investments reflects the confidence in political and macroeconomic stability in the country. A strong pipeline of foreign investment supported projects has been built up. In 2006 investments approved by the Council for the Development of Cambodia (CDC) increased almost fourfold over 2005 and amounted to US$3.8 billion. The sector allocations are as follows: US$2.9 billion for industrial sector (77 per cent of the total investments approved), US$498 million for the agricultural sector, of which US$351 million was for agro-business, and US$366 million for the services sector, of which US$330 million was for tourism. In all 88 investment projects were approved with an employment potential of 154,000 persons. 8.6. Overall Balance Overall the balance of payments in 2006 was in surplus by US$193 million. This good performance was mainly due to the increase in tourism receipts (US$963 million), the surplus of current transfers (US$694 million) and the increase in the net inflows of capital (US$383 million). 9. Conclusion The robust performance in 2006 indicates that economic growth in the medium term can be maintained at around 8-9 per cent per annum. However this will depend on the continued good per performance of garment industry, tourism, construction and agriculture. The Cambodian economy is expected to grow at a somewhat lower rate of about 8-9 percent per annum over the next several years, but growth will likely accelerate again thereafter when oil production commences in 2010 or 2011. A non-trivial portion of growth over the past decade was due to the post-conflict ‘catch tip’ phenomenon, which will likely level off over the next few years. As Cambodia confronts stiller competition from poor. Hence, the authorities will exert further efforts to secure and tenure through expediting and extending titling to remoter, poorer areas where land disputes are more serious and find ways to provide poor landless families with access to unused and.
|