|
|
 |
 |
 |
||
|
|
|
|
|
|
|
||
|
|
|
In keeping with the evidence-based theme of this report, this chapter highlights some of the main trends in the provision of development assistance in the period 2006-2008 and also looks forward to 2009 and 2010 (although the data for this latter period is only illustrative). It then combines this data with other analytical work before considering the implications for aid management policy and the H-A-R Action Plan in the context of the Rectangular Strategy and the NSDP. The application of aid analysis to the overarching development frameworks is particularly necessary at this time as the Rectangular Strategy (phase II) articulates evolving national priorities and the NSDP Mid-Term Review reflects on progress achieved so far. This provides an opportunity for Government and development partners to make any adjustments that are necessary either in the policy framework or to resource programming.
Phase II of the
Rectangular Strategy
NSDP Mid-Term Review Table Three. NSDP Allocations 2006 – 2010 (USD million)
Source: NSDP 2006 Table 5.2 and NSDP MTR 2008 Table 4.3 (derived) Other priorities identified to facilitate the achievement of the Rectangular Strategy goals are summarised as:
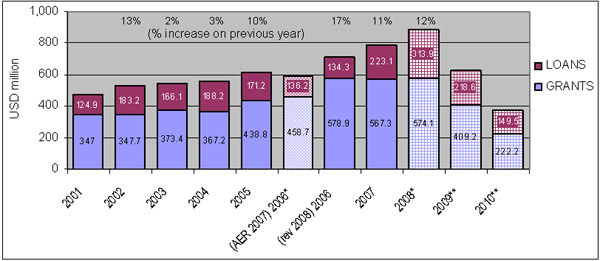
When reflecting on aid effectiveness, the national policy context must at all times be used to reconcile the evidence with progress in achieving these desired outcomes. Aggregate trends in development cooperation The overall trend in development cooperation to the end of 2008 is positive (although it must be noted that 2008 figures are still tentative), with total disbursements in 2007 estimated at USD 790.4 million, an annual increase of 11%3. Chart One shows that the rate of growth in development cooperation has also increased over time, which is a notable achievement given the stagnant or even declining global ODA volume. Chart One. Disbursements and Projections 2001-2010 (USD million)
Note: 2008 – 2010 omits NGO own resources. 2009-2010 data includes committed funds only. Chart One also highlights other important features:
The source of development cooperation financing is shown in Table Four, below. As in previous years, the largest source of development cooperation in 2007 was from Japan, who contributed USD 122.1 million (15% of the total and an 18% annual increase). Also notable is the significant support provided by China, a 75% annual increase, primarily to the infrastructure sectors. Other noteworthy observations include:
Table Four. Disbursements and Projections by Development Partner 2002-2010 (USD millions) |
Note: 2008 data is estimated outturn. Some partners provide indicative 2009–2010 figures for active/pipeline projects only |
||||||||||||||||||||||||||||||||||||||||||||||||||||||||||||||||||||||||||||||||||||||||||||||||||||||||||||||||||||||||||||||||||||||||||||||||||||||||||||||||||||||||||||||||||||||||||||||||||||||||||||||||||||||||||||||||||||||||||||||||||||||||||||||||||||||||||||||||||||||||||||||||||||||||||||||||||||||||||||||||||||||||||||||||||||||||||||||||||||||||||||||||||||||||||||||||||||||||||||||||||||||||||||||||||||||||||||||||||||||||||
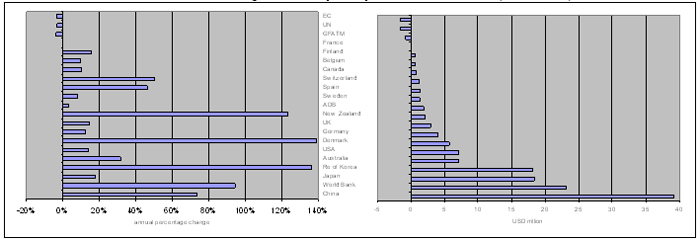
Annual changes in development partner disbursements are detailed in Chart Two, below. It emphasises the increased support that was provided by almost all development partners in 2007 and provides one indication of the depth of support to national development efforts. |
|
An important initiative that has benefited from significant cooperation between Government and development partners has been in efforts to strengthen projections that can be used to develop the budget, the Public Investment Programme (PIP) and the Medium-Term Expenditure Framework (MTEF). The NSDP Mid-Term Review (MTR) and the Evaluation of Aid Effectiveness (self assessments and Independent Review) noted that the links between CRDB’s ODA Database and the central planning and budgeting process remain tenuous and the NSDP MTR calls for “more combined and concerted efforts…among the four main central agencies, MoP, MEF, SNEC and CRDB”. The provision of data by development partners, although still incomplete and relating only to projects already active or pipelined, demonstrates, however, that national systems are becoming stronger and that development partners are beginning to respond to the commitments they made in Accra4. Continued progress in the context of improving predictability (see discussion, below, under Alignment) will therefore remain a priority for the medium term. Long-Term Trends in Development Cooperation Over the period 1992 to 2007, a total of USD 7.86 billion in disbursements has been reported by development partners to Cambodia. These have included contributions of:
The largest single development cooperation contributor is Japan, which, quite remarkably, has provided 20% of all development cooperation resources in the period 1992-2007. Other major development partners are:
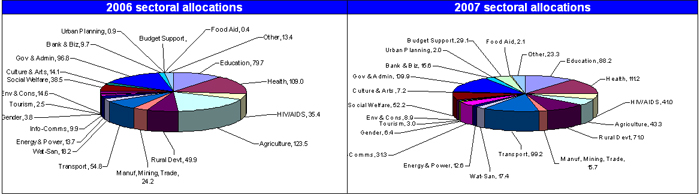
Looking forward, it is important to note that new sources of financing are likely to have a considerable impact on the financing profile. Rapid increases by China and the Republic of Korea are noted in Table Four, above, while new cooperation agreements with Qatar and Kuwait, which were concluded in early 2008, will be translated into formal commitments, and then disbursements, primarily to the rural sectors. The profile of support in other sectors will also be affected, for example in health and education, where the Global Fund and the Education For All Fast-Track Initiative, have established themselves as major sources of assistance in their respective sectors in a relatively short time. The future challenge may therefore be framed in terms of managing increased diversity in funding sources (discussed in further detail below), a challenge that is mirrored globally as there are now some 56 official donors and over 230 multilateral agencies and funds (over 100 in the health sector alone), a trend that has been increasing in spite of Paris Declaration commitments to greater efficiency5. Sectoral trends in development cooperation The allocation of development assistance has traditionally been directed to soci activities, as can be seen in the pie charts below for both 2006 and 2007. These show the continued high levels of support to both education and health (which sums to USD 144 million in 2006 and 152 million in 2007 when HIV/AIDS Chart Three. Sectoral allocations of development assistance 2006 and 2007 (USD millions) |
 |
|
is consolidated with general health sector support). Also noteworthy is the significant increase in rural development and transportation in 2007. It is useful to disaggregate these disbursements in terms of the four main NSDP sectors, and this analysis is presented in Table Five, below. Table Five. Development cooperation disbursements by sector 2005 – 2008 (USD millions)
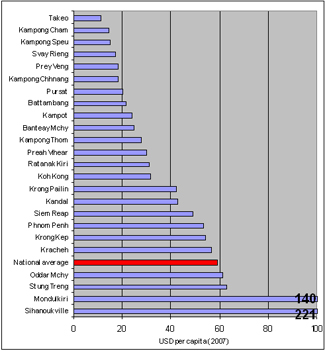
Consistent with NSDP priorities, comparing 2005 (the year before the NSDP commenced) with 2007, gender, governance, rural development and HIV/AIDS are the main beneficiaries of aid reallocations, although it is perhaps surprising to witness the declining trends in water & sanitation and in environment & conservation sectors. Notable changes in 2007 compared to 2006 include the beginning of the PRGO budget support operation, an increase in food aid, which may be seen as a positive response to increased food insecurity, and continued growth in investment in the tourism sector, which has been identified as having significant potential for growth and employment. Support to the provinces In previous years it has been difficult to present meaningful analysis about provincial disbursements as data quality was a concern (national projects were classified as benefiting Phnom Penh only or data was simply not made available). Efforts to validate this information, with a longer-term view to informing the increased focus on rural development, have resulted in some improvements and some basic analysis is now possible. Table Six, below, shows that overall, development assistance to the ten largest beneficiary provinces in 2007 amounted to USD 329 million, three times higher than the USD 110 million received by the other fourteen provinces combined.
partners in 2006 and USD 106 million in 2007. The main area of activity was in governance but there was also a large share of agriculture, rural development and multisectoral support activity (itself mainly a combination of agriculture, rural development, and water and sanitation). There were also important contributions to gender and culture financed by development partners but, as with governance, these are not activities that NGOs themselves appear to fund directly from their own resources. The role of NGOs in providing direct services, as well as supporting governance and policy advocacy functions, is very clear, and improved data sharing has allowed their significant contribution to be more fully understood. During 2007 and 2008 there appeared to be more engagement between civil society organisations and Government in general, which can be considered a healthy development given the role identified for civil society during the NSDP Mid-term Review. The recent Evaluation on Aid Effectiveness also observed that civil society has an increased role to play in terms of becoming a more engaged partner in dialogue wherever it is appropriate, as well as in ensuring that the implementation and management of their own activities aspire to the same standards of efficiency and effectiveness as for other forms of development assistance (and observing recent progress in introducing the Code of Ethical Principles and Minimum Standards). Noting that NGOs increased their own expenditure on agriculture and rural development in 2007, as well as managing more resources from development partners in these sectors, the role of NGOs in supporting the implementation of this Rectangular Strategy priority becomes immediately apparent. Table Seven. NGO sector support 2006 – 2007 (USD million)
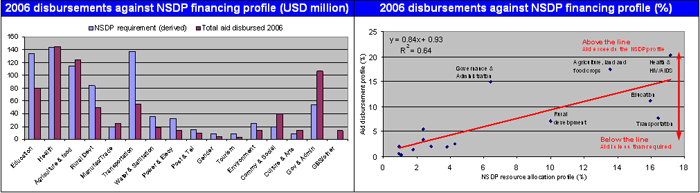
Reviewing the evidence of H-A-R Action Plan implementation in 2007 and 2008 The data presented above can be applied to the experience of implementing the H-A-R Action Plan, in particular in reviewing the recommendations included in the 2007 Aid Effectiveness Report, the Paris Declaration Monitoring Survey and the recently-completed Evaluation. While the data has shown that aid flows have increased and that both development partner and NGO focus appears to have turned to the rural development priorities identified by Government, the Independent Review of Aid Effectiveness found that, in common with many partner countries, Cambodia faces a challenge of "moving the aid effectiveness agenda out from the centre of a few key agencies at the heart of Government, to become a working reality in the ministries and communities where it must ultimately be implemented." This evidence, combined with the data presented above, can therefore shed light on how effectively these funds are managed and the nature of any changes in aid management practices that are required to enhance development results. "The Cambodian record of setting out policies and processes to improve the effectiveness of aid has been an impressive one…in every one of the positive cases identified the main credit for progress is attributed to some combination of strong leadership and capacity" Independent Review of Aid Effectiveness in Cambodia (2008) Ownership as a concept has sometimes been elusive but it may be thought of as existing in both 'hard' and 'soft' forms. The harder aspects of ownership concern the policy frameworks, the planning and budgeting tools and the quality of the processes by which they are managed. The softer side relates to the political leadership and technical capacities that are required to make the central policy, planning and budgeting systems function effectively. A number of analytical inputs have been produced in 2007 and 2008 that recount the progress that has been made in strengthening policy frameworks and institutional arrangements. With regard to progress in consolidating planning, budgeting and implementation, at central level the NSDP MTR and the recent Evaluation of Aid Effectiveness reported a mixed picture. Each individual component – the articulation of the Rectangular Strategy Phase II, the process of preparing the NSDP Mid-Term Review, stronger macroeconomic performance and budgeting under the PFMRP, and improved aid management as a result of Government collaboration with development partners – represents encouraging progress but there still remains a coordination challenge in making these component parts function as a coherent whole. The Independent Review observed that "Institutional arrangements to carry out NSDP functions are poorly integrated and weakly connected", an observation that is shared by the Ministry of Planning, who wrote in the NSDP MTR that "much more active progress needs to take place, with urgency." These findings are borne out by the recent Paris Declaration monitoring survey, which noted progress but recommended that "an increased focus needs to be placed on the development and strengthening of country systems at all levels (planning, budgeting, execution, reporting, monitoring & evaluation)." As a result, Cambodia has been placed in the category of countries (group C) that has established the system's core but are still to effect sufficiently strong institutional linkages. It must also be noted that this central bottleneck constrains planning, costing and budgeting activity at line ministry level and this was demonstrated by a number of TWGs during the self-assessment stage of the Evaluation of Aid Effectiveness. A second strand to the ownership challenge concerns the need to exercise leadership and develop capacities for effectively managing resources. In this regard much more progress has been made and the Independent Review noted "a good deal of evidence that the Government and a number of its agencies have indeed been increasingly clear and assertive in expressing their priorities." Associated efforts have been made at technical and management levels as training and block grant support has strengthened the technical competence and administrative capacity of the TWGs while on-going dialogue continues regarding the effective management of consultative fora, including the GDCC, so that these mechanisms may be sure to function effectively. A final consideration requires a more fundamental reflection on the nature of ownership itself, its basis in power relations, and the way in which it manifests itself in the Cambodia context. Given the inherent imbalances – in terms of financial resources and technical capacities – within and between the national partners (central Government, line ministries, National Assembly and civil society) and external agents, the extent to which ownership is sustained internally or bestowed externally becomes an important consideration. Recent global analysis associated with the Paris Declaration suggests that, rather than working within the reality of the national context and understanding the dynamics that result, some development partners still impose externally-driven change, retrofitting the development landscape to the global paradigm to ensure that their programmes are compatible with these global norms rather than the national context. Well entrenched cultural, administrative and political interests reinforce consequent inefficiencies in aid and recent analysis of technical cooperation in Cambodia suggests that similar factors may apply in the case of Cambodia6. So how to proceed? Many of the building blocks are in place and the Strategic Plan for supporting the Ministry of Planning represents an important opportunity for further strengthening central coordination functions. Strengthening linkages between central agencies – MoP, MEF and CRDB – must then proceed at three levels: by consolidating the political leadership articulated in the Rectangular Strategy by creating an appropriate set of incentives for enhanced information sharing and management; and by developing capacity to effectively plan, budget and monitor NSDP implementation. The insights presented by the Independent Review of the Evaluation suggest that limiting the complexity of future planning exercises can improve responsiveness and implementation, first by allowing for a more direct link between objectives agreed at a high level and the strategies to implement them, and, second, by removing technical barriers that currently limit national engagement to a relatively small core of technical experts. "Donors agree to use country systems as the first option" Accra Agenda for Action (2008) Alignment makes reference to: (i) the degree of 'fit' between national development priorities and development partner support, and (ii) the strengthening and use of national systems for programming, disbursing and reporting on aid-financed activity. It was therefore encouraging that the Paris Declaration monitoring survey (see Table Two, page 5) recorded progress in recording aid in Government systems – up to 85% in 2007 compared to 79% in 2005 – and greatly improved aggregate predictability (the ratio of planned to disbursed aid was 96%). The main factor in these successes – which have the potential to greatly reinforce the planning and budgeting exercise – reflects improved systems and working practices by both Government and development partners. The Cambodia ODA Database, maintained by CRDB, but using information provided by development partners and validated by Government, provides a budget-compatible tool for recording commitments and disbursements. In addition, as a result of the ODA Database serving as a common tool for both parties, any discrepancy between disbursements reported by development partners and those recorded by Government are eliminated. The fisheries sector also reports similar progress in setting up systems at a sectoral level, although the willingness of development partners to make use of these systems is less emphatic. These initiatives demonstrate the rapid progress that can be made in strengthening and using national systems if both parties are prepared to make a commitment to doing so. Other Paris Declaration monitoring indicators revealed a less optimistic picture: the number of Project Implementation Units (PIUs) increased from 49 to 121 and there was very limited evidence of any increase in using Government financial management and procurement systems7. These indicators need to be nuanced in the Cambodia context, however, as recent work underlines that addressing their underlying causes is likely to be a long-term undertaking. Capacity development analysis, associated with the use of technical cooperation, showed that the use of PIUs is rooted in the reality of fragile national systems so that, whether integrated or parallel, their presence is accepted by many as necessary, even desireable. The strengthening of public financial management systems, considered to be making significant headway, is a further example of how the use of Government systems must be viewed in a longer-term capacity development context. A greater challenge in alignment concerns the management of cross-sectoral issues such as gender, HIV/AIDS, child welfare, food security and land management. The Gender TWG reported some notable successes in coordinating the Cambodia Gender Assessment 2008 across a broad range of stakeholders and was also able to engage effectively in the preparation of the Anti-Trafficking Law and the Organic Law on Decentralisation and Deconcentration, however significant challenges remain. This view was echoed by other TWGs during the self-assessment phase of the Evaluation of Aid Effectiveness as all those engaged in cross-sectoral work indicated some difficulty in establishing sufficiently robust institutional linkages. This is perhaps symptomatic of broader policy networking challenges in Cambodia and may require concerted action by TWG chairs, development partner facilitators and, possibly, within the GDCC. An assessment of the programming and delivery of development assistance provides perhaps the most practical indicator of alignment. Given the limitations and relevance of the Paris Declaration indicators to Cambodia, this analysis has provided the basis for the NSDP MTR observation that more effort still needs to be made to align resources. Alignment can therefore be seen as a test of allocative efficiency: if we do not allocate funds to the correct activities then we will not achieve the desired results. The evidence may be considered in two ways, first in terms of absolute alignment and then in the relative profile of aid delivery. Using the revised NSDP costings detailed in Table 4.3 of the NSDP MTR, the implied total annual requirement to implement the NSDP is USD 840 million, which means that total development assistance financed 85% of total required NSDP requirements in 2006 and 95% in 2007: at the most aggregated level external support is closely aligned to national requirements. Chart Five shows the sectoral disbursements against average annual NSDP requirements and it can be seen that some sectors are adequately resourced (governance, health, agriculture and food crops, and community and social welfare) while others were relatively under-resourced (rural development, transportation and education). Chart Five. Alignment of Development cooperation to the NSDP 2006 |
|||||||||||||||||||||||||||||||||||||||||||||||||||||||||||||||||||||||||||||||||||||||||||||||||||||||||||||||||||||||||||||||||||||||||||||||||||||||||||||||||||||||||||||||||||||||||||||||||||||||||||||||||||||||||||||||||||||||||||||||||||||||||||||||||||||||||||||||||||||||||||||||||||||||||||||||||||||||||||||||||||||||||||||||||||||||||||||||||||||||||||||||||||||||||||||||||||||||||||||||||||||||||||||||||||||||||||||||||||||||||||||||||||||||||||||||||||||||||||||||||||||||||||||||||||||||||||||||||||||||||||||||||||||||||||||||||||||||||||||||||||||||||||||||||||||||||||||||||||||||||||||||||||||||||||||||||||||||||||||||||||||||
 |
|
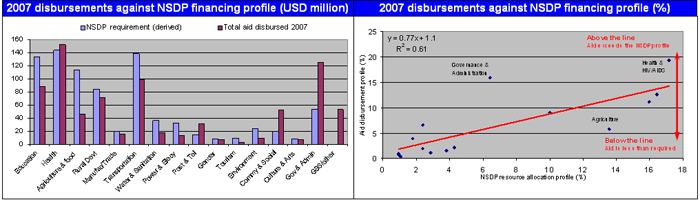
In this regard it is important to emphasise the importance of domestic resources and the budget process as a means of ensuring that all priorities are adequately resourced as well as securing effective use of the limited but increasing PRGO budgetary support resources. Comparing financial requirements and commitments is a useful point of departure for considering alignment but the relative shares in resource allocation are also of interest as, when the total resources required and deployed are not quite equivalent, this approach can bring the relative over or under-funding of each sector into sharper focus. The scatter plot on the right of Chart Five shows that in 2006 the relationship between requirements and provision – alignment – was statistically very high. This shows that alignment to national priorities was relatively good, although as the NSDP has observed, there is still room for more progress as the gap between required and actual resourcing in governance, rural development and transportation has shown. The analysis is repeated for 2007 and reveals a broadly similar picture, although the reduced funding to agriculture after the one-off increase provided by IMF debt relief in 2006 has meant that this sector is now relatively under-funded (although these debt relief resources will actually be expended on agriculture, irrigation and rural water activities from 2007 and beyond). Transport infrastructure financing also increased quite significantly, in part due to the increased resources from China, although the sector still displays a shortfall. Chart Six. Alignment of Development cooperation to the NSDP 2007 |
 |
|
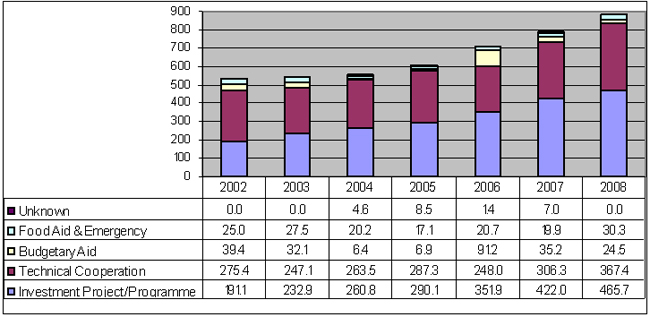
The alignment of modalities is also an important area for consideration. Government has previously expressed its preference for more programmatic assistance (discussed under harmonisation, below) and for budget support. The onset of the Poverty Reduction and Growth Operation (PRGO) was therefore welcomed by Government in 2007 and disbursements by the World Bank and Japan in 2007, joined by UK/DFID in 2008, resulted in USD 30 million (2007) and USD 22 million (2008) being made available8. Otherwise the extent to which increased programme-based funding recorded during the Paris Declaration survey has actually aligned with national systems is a moot point, as indicator 5 shows little movement towards their use. The experience of Cambodia is perhaps not unique as globally it has been observed that "joint financing and implementation arrangements continue to be defined by donors, sidestepping regular sector structures and procedures – harmonisation without alignment.9" Chart Seven. Disbursements by type of assistance 2002 - 2008
Given the importance of capacity development, the provision of technical cooperation has been the focus of particular attention in 2007 and 2008. Following the analysis undertaken in the 2007 Aid Effectiveness Report a consideration of the role of technical cooperation in supporting the core reform programmes and other capacity development support resulted in the production of a Guideline on the Role and Management of Technical Cooperation, ideally to be implemented as part of the Council for Administrative Reform's overall policy on capacity and human resource development. In light of the observation in last year's report that "the reliability of the analysis is open to question" many development partners, principally USAID, took the opportunity to review support categorisation and reclassified much of their TC as investment assistance. As a consequence the number for technical cooperation provision in 2006 reported in last year's report of USD 275 million – approximately half of total disbursements – has been revised to USD 248 million so that, in the context of an increased revised total disbursement of USD 713 million, the overall share of technical cooperation in 2006 falls to 35%, rising slightly in 2007 to 39%. As Chart Seven has shown, the largest modality of support is the investment project, which accounted for 50% of support in 2006 and 2007 (details for each development partner are provided in Table Eight, below). Table Eight. Development partner disbursements by type of assistance (USD million)
Note. Glossary attached as Annex Five defines each type of assistance Predictability In addition to aligning with national priorities, using local systems and providing support through the use of an appropriate modality, the predictability of aid delivery can have a profound effect on ensuring the effectiveness of aid. The global dialogue that took place prior to the High-Level Forum in Accra identified this issue as particularly pertinent so it is pleasing to note the significant progress that Cambodia has made in improving aid predictability in the last two years. In the context of on-going public financial management reform, the development of the Cambodia ODA Database, and the shift from formal pledging at the Consultative Group towards indicative medium-term projections shared at the CDCF, more emphasis has been placed on planning and programming of resources. The Paris Declaration monitoring survey then provided an opportunity to record this progress and showed a close match between scheduled and actual within-year disbursements (see Table Two, page 5). Principal indicators of predictability concern the use of figures provided at the CDCF for the Multi-Year Indicative Financing Framework (MYIFF) and those recorded in the ODA Database. Table Nine, below, shows that, although aggregate predictability in 2007 is recorded at 99% (for those partners who provided an estimate at the CDCF in June 2007), there is significant variance between individual partners. Repeating the analysis for 2008 shows even larger variance for individual development partners and a significantly higher estimated figure for 2008 than anticipated at the CDCF. Table Nine. In-year predictability of development assistance 2007 and 2008
The MYIFF and ODA Database tools are now well established as mechanisms to support planning and programming of development assistance. Continued cooperation is required to ensure that progress recorded to date can be consolidated and translated into more effective budgeting and programme management. Harmonisation and Partnerships "A good number of line ministries have come to take stronger ownership of the aid effectiveness agenda at the sectoral level and display readier willingness to challenge development partners to live up to their harmonisation commitments." Independent Review of Aid Effectiveness in Cambodia (2008) The H-A-R Action Plan's harmonisation objectives prioritise the use of programme-based approaches (PBAs) and delegated cooperation arrangements as measures to promote the efficient delivery of aid by strengthening ownership, aligning with national priorities and promoting the use of national systems. The 2008 Paris Declaration monitoring survey recorded only a small increase in programme-based support, however, mostly due to the increased number of PBAs rather than a demonstrated increase in eligible funding to existing PBAs. This perhaps indicates that established PBAs are struggling to make further headway and, having assumed the transaction costs associated with these new modalities – joint planning, dialogue, review etc – there is now a risk that, with continued parallel funding, these sectors will become locked into a permanently higher transaction cost scenario. While PBAs must endeavour to accommodate all forms of financing modality they must also strive to move beyond their current working arrangements which at times do not extend beyond the provision of loosely coordinated annual planning and review functions. At a minimum this may mean reflecting the finances and activities of all forms of support in the annual operational plans as a basis for comprehensive programming, making more use of national reporting systems, and adopting common methods of monitoring and review. Given the progress to date and the preparations that are currently underway in a number of other sectors to adopt programmatic approaches, there is cause for cautious optimism that progress may be made, however the challenge is formidable and may be complicated further by vertical funds and other new sources of development financing. The number of delegated cooperation arrangements remained relatively low in 2007 (27 instances of partners leading a co-funded project) and there were 41 instances of partners delegating funds to another – but where sporadic outbursts of harmonisation did take place in 2007 the flows involved in the projects identified in Table Ten totalled USD 64 million, 9% of development partners' total support. Prospects for further delegation and/or cooperation appear good as the PRGO operation and health sector pooled funding were important initiatives that took place in 2008. Table Ten. Partnership arrangements reported in 2007
The initial enthusiasm for PBAs in Cambodia was seen as a response to high levels of aid fragmentation. The analysis presented in the 2007 Aid Effectiveness Report provided a compelling case for making an increased
While the principle of accepting all aid modalities is agreeable, this demonstration of excessive aid fragmentation complements the 2007 Herfandahl index and emphasises the need to reduce the excessive costs of project management. It is also the case that if 'everyone does everything' then it is difficult to associate inputs with results, resulting in sector monitoring becoming more about collective responsibility than mutual accountability. Having reviewed the evidence there appears to be no alternative to increased effort to strengthen PBAs, so that they actually deliver their promised efficiencies, to increasing the number of delegated cooperation arrangements and to introducing some form of division of labour approach. This latter initiative has been discussed in Cambodia, most recently in the context of the EU Roadmap. It has been observed globally that "the lack of progress on sector concentration relates to counter-incentives on both the donor and partner country sides [meaning that the process can be] highly contentious, with some donors taking steadfast positions on their comparative advantages."10 This means that, while the Accra Agenda for Action reasserts the Paris Declaration principle that it should be the partner country to lead this process, it can understandably be a fraught and precarious undertaking for an aid-dependent Government. Indeed this may partly explain why so much has been written globally of 'division of labour' while little has actually been done. It is possible to establish principles, however, and the Government is willing to set out its vision for how such an exercise may be conducted. It is also prepared to facilitate such a process between willing partners but, beyond the negotiation of a country strategy and consultations during programming, it is challenging for Government to direct its development partners as to which areas they may support. Notwithstanding these limitations, these principles might include:
For the lead facilitator of a TWG it has also been agreed that, consistent with the TWG Guideline, they must be at a senior level, competent in the field, active in information sharing and be able to contribute to the development of the TWG and its secretariat. The additional Government preference that a lead facilitator should normally serve for at least two years may imply some practical difficulties given the short assignments of some senior development partners. While these principles may provide a starting point it is also necessary to temper them by observing that the complexity of programming development resources – the difficulty in identifying specific sector categories, for example – means that this approach can only serve as a starting point to rationalize and some degree of pragmatism and flexibility will therefore be required. Harmonisation is perhaps where aid effectiveness fatigue is most acute, with many meetings of development partners dedicated to efforts at identifying common approaches. It is also noteworthy that a significant number of the development partner self-assessments for the Evaluation of Aid Effectiveness identified a lack of internal awareness and incentives for pursuing more collaborative approaches; for some agencies the need for managing aid more effectively may not be a priority but for Government, with limited capacity, it most certainly is. While many of these activities are therefore worthwhile and should continue another response may be to move beyond 'aid effectiveness' as a specialised area and to apply its principles more pragmatically and more directly at sector level, identifying key bottlenecks and joint actions that are required. The challenge is to bring these discussions down to the sectors and make them relevant at that level. "We will be judged by the impacts that our collective efforts have on the lives of poor people" Accra Agenda for Action (2008) The ability to monitor and evaluate is considered to be essential for decision-making. Obtaining accurate, timely and relevant information is perhaps the single most important part of the policy-making and monitoring process. This report provides one example of how evidence can be collected and used to support policy and to inform implementation of development activity. Perhaps the must significant results-based exercise that has taken place, however, concerns the NSDP, which has identified a number of areas where progress has been made, for example in improving health outcomes and rising agricultural productivity, and where dialogue between all stakeholders at sector level may ensure that these gains are consolidated. The Independent Review of the Evaluation of Aid Effectiveness therefore emphasised the importance of strengthening the national poverty monitoring framework associated with the NSDP, which, together with the linking of sub-national systems, remains one of the most formidable challenges in fostering evidence-based development management in Cambodia. More broadly, the Evaluation of Aid Effectiveness self-assessments showed that monitoring systems at sector level are improving, albeit at a slower pace than many had hoped for. Many TWGs reported that a good deal of the challenge lies in being able to associate the results that they see with the inputs that have been provided. This problem of attribution is exacerbated as there is often a weak causal link between plans, budgets, implementation and reporting. This emphasises the need to take a holistic approach to monitoring and results management, recognising that if the earlier pre-conditions have not been met then monitoring can become a spurious task. For this reason it is encouraging to note recent initiatives taken in some sectors to establish an integrated managing for results cycle and to overcome what the Independent Review observed as a tendency for "scattered and uncoordinated external support to monitoring and evaluation that has resulted in a somewhat piecemeal information system". The legal and judicial sector is one example in which each stage of the management process makes reference to results management as well as to other aid effectiveness principles that will help to ensure a sucessful outcome. Other sectors and their associated TWGs, including mine action and agriculture and water have also reported progress in developing sector approaches that include monitoring plans while these approaches are well established in sectors such as health and education. For other sectors that are still making headway, perhaps the global observation that "perfect plans can be illusory, instead of delaying implementation actors should focus on results to be achieved, take calculated risks and monitor results closely" will encourage them to move forward in a pragmatic manner11. "We will hold each other accountable for mutually agreed results in keeping with country development and aid polices" Accra Agenda for Action (2008) Managing for development results is often closely associated with mutual accountability as it is the results that are achieved for which Government and development partners are ultimately held to account. Joint learning also implies that responsibilities can be assigned and collaborative actions can be taken, as is the case for the Joint Monitoring Indicators (JMIs), which are reviewed in Chapter Four. In its most basic form, the link requires that information on resources made available is shared so that these resources can be allocated and managed so that results can then be measured. This allows for a distinction to be made between commitment at the policy level (intended actions) and actual results (implementation). While globally this continues to be a challenging area, Cambodia has made marked progress as development partners have invested in their capacity to share information through the Government's on-line data platform. Not only does this support the effective planning and monitoring of development assistance by Government, it also promotes transparency by making this information available to a wider group of interested persons. Additional mutual accountability good practices include the undertaking of a mutual and/or independent assessment of the development partnership. Cambodia's Evaluation and Independent Review met these criteria and many of the findings have been incorporated here to inform the Report's policy recommendations. They will also provide an input to the dialogue at the forthcoming CDCF as well as to the TWGs which is where the mutual accountability nature of the development partnership is most evident. The Independent Review exercise endorsed the view that information sharing on aid delivery had improved but raised some additional considerations that may warrant a response. These included the incentives that exist within development partner agencies and the belief that "the aid effectiveness agenda could not be successfully implemented at the country level without some fundamental and systemic changes in the incentive structure to promote behaviours in line with aid effectiveness principles". Definitions of mutual accountability in the global setting have been evolving and the Accra Agenda for Action includes a partner country commitment to promote the role of elected representatives and civil society. This extends the original Paris Declaration commitment beyond information sharing, a role most TWGs appear to perform quite well. A number of TWGs also acknowledged the positive role of civil society especially when related to socio-economic issues (rural water, HIV/AIDS). Many other TWGs, and most development partners, saw a more high-profile role for civil society, primarily in their capacity as sector experts and as representatives of wider interests. The Independent Review also proposed an enhanced role for the National Assembly and observed that civil society was maturing rapidly to the extent that they could make an important contribution to mutual accountability, both with regard to being more open about their own activity as well as playing a role in the broader development partnership arrangements. The H-A-R Action Plan: A framework for effective development cooperation "There is huge energy and focus being directed to creating platforms and procedures to make aid more effective, and not enough action by those who must actually move to make it happen. There seems almost a danger that the preparation is becoming an excuse for the limited action" Independent Review of the Evaluation of Aid Effectiveness in Cambodia (2008) Drawing together the analytical inputs provided by the NSDP Mid-term Review, the Evaluation of Aid Effectiveness, it's associated Independent Review and the technical cooperation analysis, and then combining them with the empirical data produced during the Paris Declaration monitoring survey and the preparation of this Report, a significant body of evidence begins to form. While the overall picture is inevitably complex it is nevertheless possible to make some summary observations that characterise the development partnership. In short, it can be seen that development cooperation support continues to increase and, in the main, is consistent with Cambodia's development priorities. Significant challenges remain, however, if these resources are to be delivered and managed in a manner that will maximise their developmental impact. First, as the Independent Review noted, significant progress has been made in establishing policy and institutional frameworks. While these have become familiar to Government and development partners alike, the evidence with regard to implementation is more mixed and Cambodia finds itself in a similar situation to other partner countries. It is unfortunate that in a practice area as inclined to jargon as this one, the newest addition to the lexicon is 'aid effectiveness fatigue'. An intervention from senior decision-makers may help to reinvigorate the process while the improved coordination between central agencies called for in the Ministry of Planning's NSDP MTR will provide momentum at the central level with subsequent benefits at sector level. A second observation is that aid effectiveness work may have become a discrete process and its manifestation as a separate practice area has resulted in it becoming excessively complex and less accessible to 'non-practitioners'. All persons involved in development cooperation activities should be well versed in the practices and principles and must therefore consider themselves to be practitioners. Taking steps forward in this regard may require simplification, more practical prioritisation and a less technical approach. Third, the sustained effort at establishing policy frameworks and creating an aid architecture comprising TWGs, the GDCC and the CDCF has not yet produced the anticipated results in terms of effective aid delivery and improved development impact. If it is not this 'hardware' that is malfunctioning then there may be a need to consider the 'software' and to invest more time and effort in building relationships, trust and the set of competencies that are required to work effectively in the context of the partnership based paradigm. A fourth observation is that the NSDP MTR implies that capacity development increasingly provides the principal rationale for development cooperation. This view was made explicitly in the technical cooperation analysis and in the Independent Review, which observed that this is the "area where understanding and respecting national ownership is most important for ensuring a partnership-based approach to developing capacity, strengthening national systems and creating an eventual exit strategy for aid". New approaches and competencies on the part of both Government and its development partners may therefore be required. Finally, to promote mutual accountability the challenge of engaging with a broader range of stakeholders takes on increased urgency. The introduction section of this report noted that the most sustainable link between aid and results is transmitted through the need to be held mutually accountable. If these summary conclusions accurately portray the current situation in Cambodia then it is then possible to make further use of this evidence to identify a series of policy recommendations. These may then form the basis for further dialogue and reflection before being formalised as a Joint Monitoring Indicator. |
|||||||||||||||||||||||||||||||||||||||||||||||||||||||||||||||||||||||||||||||||||||||||||||||||||||||||||||||||||||||||||||||||||||||||||||||||||||||||||||||||||||||||||||||||||||||||||||||||||||||||||||||||||||||||||||||||||||||||||||||||||||||||||||||||||||||||||||||||||||||||||||||||||||||||||||||||||||||||||||||||||||||||||||||||||||||||||||||||||||||||||||||||||||||||||||||||||||||||||||||||||||||||||||||||||||||||||||||||||||||||||||||||||||||||||||||||||||||||||||||||||||||||||||||||||||||||||||||||||||||||||||||||||||||||||||||||||||||||||||||||||||||||||||||||||||||||||||||||||||||||||||||||||||||||||||||||||||||||||||||||||||||||||||||||||||||||||||||||||||||||||||||||||||||||||||||||||||||||||||||||||||||||||||||||||||||||||||||||||||||||||||||||||||||||||||||||||||||||||||||||||||||||||||||||||||||||||||||||||||||||||||||||||||||||||||||||||||||||||||||||||||||||||||||||||||||||||||||||||||||||||||||||||||||||||||||||||||||||||||||||||||||||||||||||||||||||||||||||||||||