3.5 DISBURSEMENTS BY SECTOR


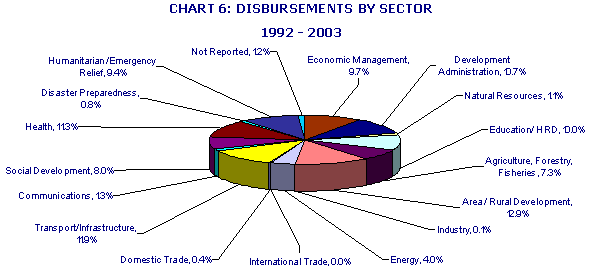
54. Over the entire period from 1992 to 2003, Area/Rural Development sector has received the largest share of external assistance (12.9 percent), followed by Transport/Infrastructure (11.9 percent), Health sector (11.3 percent), Development Administration (10.7 percent), and Education/Human Resource Development (10.0 percent).  Details on disbursements for other sectors are summarized in Table 9 below.  The data presented in Table 9 also show significant shifts over time in the composition of ODA received in different sectors. The share of ODA for Social Development sector increased from 3.7 percent in 1992-93, to 6.4 percent in 1994-98, and increased to 10.4 percent of total ODA in 1999-2003. Similarly ODA for Health sector has increased from 7.8 percent in 1992-93, to 8.4 percent in 1994-98, and to 14.8 percent of total ODA in 1999-2003. In Education/HRD sector, the share of total ODA has increased from 7.7 percent in 1992-93, to 9.6 percent in 1994-98 and to 10.9 percent in 1999-2003. On the other side, in the case of Area/Rural Development sector that received the largest share of ODA, 13.7 percent, in 1992-93, the share had increased to 14 percent in 1994-98, but declined to 11.7 percent in 1999-2003. The historical data on disbursements by sector for each year from 1992 to 2003 is presented as Annex V.


TABLE 9: DISBURSEMENTS BY SECTOR: 1992 - 2003
( in  millions of US Dollars)


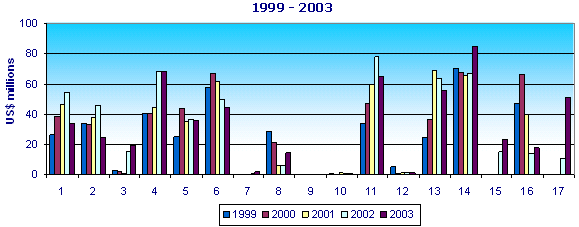
55. The data reported by donors for the last five years, 1999-2003, indicate significant changes from year to year in the share of total ODA disbursed in some sectors. However, it is not clear whether these changes are attributable to an increase in the number of cases where the data on sector has not been reported by donors or whether these are real changes. In 2002, for 1.9 percent of the total ODA that has been reported to have been disbursed the sector of program/project activity was not identified. This proportion increased to 9.5 percent of total ODA reported to have been disbursed in 2003. Looking at the data that has been reported by donors, the notable year to year changes in the sectoral composition of ODA disbursed over the period 1999-2003 are as follows:

  • Declines: both in terms of the volume and the share of ODA disbursed in the Area/Rural Development sector from a high of US$ 67.3 million representing 14.4 percent of ODA disbursed in 2000 to US$ 44.6 million representing 8.2 percent of ODA disbursed in 2003. Economic Management Sector where ODA disbursed has declined from US$ 54.7 million representing 10.3 percent of ODA disbursed in 2002 to US$ 34.1 million representing 6.2 percent of ODA disbursed in 2003. Development Administration sector that received from 7 to 9 percent of ODA during 1999-2002, declined from US$ 46.2 million representing 8.7 percent of ODA disbursed in 2002 to US$ 25.0 million representing 4.6 percent of ODA disbursed in 2003.  The Social development sector received increasing support until 2001 when US$ 69.6 million representing 14.8 percent of total ODA were disbursed in this sector. Over the last two years, ODA declined to US$ 64.1 million in 2002 and to US$ 56.1 million in 2003.

TABLE 10: DISBURSEMENTS BY SECTOR: 1999-2003
( in  millions of US Dollars)

a  The amount of disbursements for which sector was "not reported", in thousands of US$: Belgium (207.3), France (3,228.7), Norway (102.8), United Kingdom (338.1), Australia (900.5), Japan (4,309.6), and New Zealand (893.4).

b   The amount of disbursements for which sector was "not reported", in thousands of US$: FAO (152.7), ADB (17,660.0)

Belgium (40.0), France (20,736.6), Germany (6,296.6), Norway (639.0), Australia (855.9), Japan (3,459.8), and New Zealand (766.8).

  • Increases: Health and Education/HRD sectors received the highest shares of ODA disbursed in 2003. The Heath sector received around 66 to 70 million US$ each year from 1999 to 2002. In 2003, ODA to Health sector increased to 84.4 million US$ from 67.6 million US$ in 2002. The Education/HRD sector received around 40 to 45 million US$ in 1999, 2000, and 2001. In 2002, ODA to Education/HRD sector increased significantly, by around 53 percent from the 2001 level, to 68.9 million US$. In 2003, Education/HRD sector received 69 million US$, about the same as in 2002. There was also a significant increase in support for the Natural Resources sector in the last two years. In the years 1999, 2000, and 2001 this sector had received between 1 to 3 million US$. In 2002 and 2003, ODA to this sector increased to 15.3 and 19.0 million US$, respectively. Disaster Preparedness is another sector that has begun to receive donor support in recent years. In 2002 and 2003, the data reported by donors shows ODA disbursements of 15.0 and 23.3 million dollars in this sector.


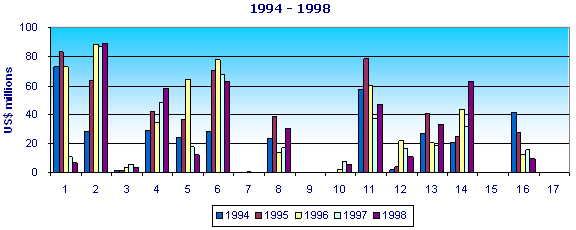
Sector Code    
  1. Economic Management
2. Development Administration
3. Natural Resources
4. Education/HRD
5. Agriculture, Forestry,& Fisheries
6. Area Development
7.  Industry
8.  Energy
9.  International Trade
10. Domestic Trade
11. Transport
12. Communications
13. Social Development
14. Health

15. Disaster Preparedness
16. Humanitarian Aid & Relief

17. Not Reported


| Content | Back | Top | Next |
Home | Agenda | Contents| List of Participants | Position Paper | DCR | DCR Annex | Partnership | Download | Map | Photo | Search