|
|
 |
 |
 |
||
|
|
|
|
|
|
|
||
|
|
|
4.1 OVERVIEW 38. The analysis presented in this section is based on data that has been provided by the multilateral and bilateral donors and the NGOs in response to the questionnaire that was provided to them by the study team. The responses to the survey do not constitute a representative sample of all programs/projects that were supported by various development partners in 2002 and therefore caution should be exercised in extrapolating the results. Overall, the UN agencies have provided information for nearly all of the programs/projects they delivered in 2002. The other multilateral donors (World Bank, Asian Development Bank, and the European Commission) have responded to a lesser degree. The responses from the bilateral donors have been rather disappointing. They have provided the requested data for only 61 programs/projects supported by them, representing less than 20 per cent of the projects and less than 27 percent of the total disbursements in 2002 that they have reported to the Council for the Development of Cambodia (CDC). In the case of NGOs, the data was collected and analysed by The Cooperation Committee for Cambodia (CCC). It has been estimated by CCC that the total expenditure on programs/projects for which NGOs have provided data represent around 75 percent of expenditure on programs delivered by NGOs in 2002.
39. In terms of overall coverage of the capacity building survey, the programs/projects for which the external partners (multilateral and bilateral donors and NGOs) have provided information represent, in terms of total reported expenditures in 2002, around half of the total disbursements of all external partners in 2002. 40. The external development partners of Cambodia combine a variety of strategies and actions to both ensure that they have the capacity to deliver the program/project activities and to achieve their program’s/project’s stated objectives. In terms of the incidence of various capacity building activities of the 147 programs/projects of the multilateral and bilateral development partners and the 77 NGOs that have provided data:
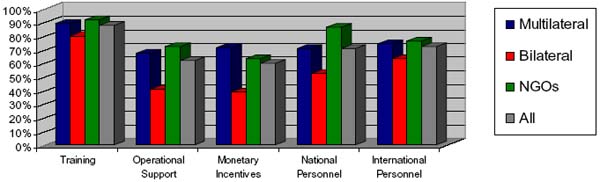
TABLE 2: INCIDENCE OF CAPACITY BUILDING ACTIVITES IN 2002
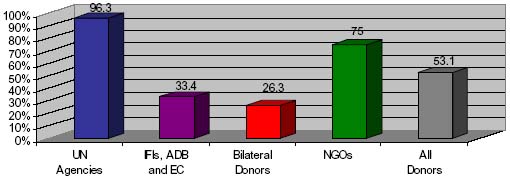
41. Among the three groups of development partners (multilateral, bilateral, and NGOs), a higher proportion of NGOs provide support for various capacity building activities than do multilateral or bilateral donors. Among the multilateral and bilateral donors, multilateral donors have a higher incidence of providing support for capacity building activities than do bilateral donors (Table 2). 42. Also in terms of resources spent, NGOs spend a significantly higher proportion of their program resources to support capacity building activities than do multilateral or bilateral donors (Table 3). Moreover, it should be noted that in the case of NGOs, the estimates of the costs of national and international staff represent a minimum figure. Some NGO respondents were not able to put a monetary value on international staff costs as they are volunteers, self funded or paid by headquarters and some benefits for national staff were not included. In addition, some NGOs noted that all in-country and overseas training costs were not included in the NGO program budgets as they were funded externally through scholarships, international donors, other NGO programs or headquarters. 43. A total expenditure of 115.3 million US dollars on various capacity development activities has been reported by the 147 multilateral and bilateral programs/projects and the 77 NGOs – representing 43.4 percent of their total expenditure reported in this survey for 2002. The expenditure on specific capacity development activities, include:
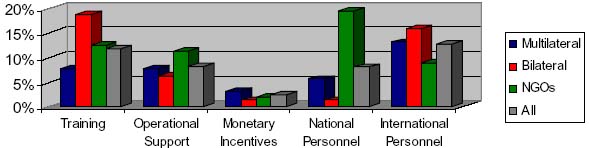
TABLE
3: EXPENDITURE ON CAPACITY BUILDING ACTIVITES IN 2002
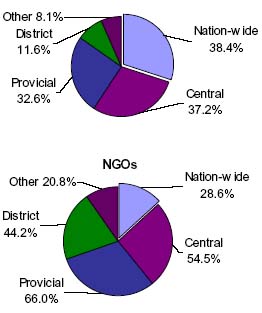
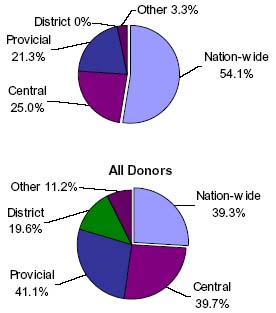
44. For the programs/projects reported in the CBP Survey, many respondents have indicated multiple locations meaning that they work at or across a number of locations. Overall, the activities of the programs/projects are well spread across the country. In terms of specific location, the largest proportion of the programs/projects, just over 41 percent, have reported their activities to be at the “provincial” level, followed closely by “nation-wide”, and “central” for just under 40 percent of the programs/projects. Less than twenty percent have identified the program/project activities at the “district” level. However, there are significant differences among the three groups of donor: multilateral, bilateral and NGOs. A significantly higher proportion of NGOs deliver their activities at the provincial and district levels than the multilateral or bilateral donors. In fact, none of the programs/projects of the bilateral donors have identified “district” as the primary area of their activities. Most of the bilateral donor programs are targeted either at the “central” level or are “nation-wide”. The programs/projects delivered by multilateral donors fall somewhere in between. TABLE 4: GEOGRAPHIC LOCATIONS OF DONOR PROGRAMS/PROJECTS ACTIVITIES
45. The sector focus of the program/projects for which data has been reported in the CBP Survey is quite different among the multilateral and bilateral donors. In terms of total program/project expenditure in 2002 just over two-third of expenditure of bilateral donors was concentrated in four sectors: development administration (27.3 percent), agriculture, forestry and fisheries sector (16.1 percent), education sector (13.3 percent), and the health sector (10.5 percent). In the case of multilateral donors, just over two-thirds of the programs/projects expenditure was in the following three areas: multi-sector (36.1 percent), area/rural development (19.3 percent), and transport sector (11.6 percent).
TABLE
5: TOTAL EXPENDITURE IN 2002 ON PROGRAMS/PROJECTS REPORTED
IN THE CBP SURVEY BY SECTOR
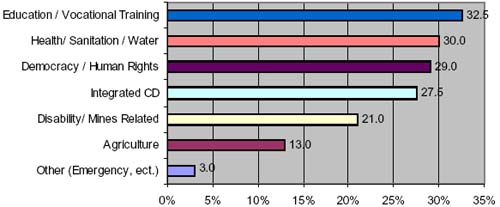
46.
In terms of the sector of their project/program activities, Education and
Training, Health, Democracy and Integrated Community Development Projects
lead the areas of NGO programming, followed closely by the social
development sector, including disabilities, mine related activities and
other vulnerable groups.
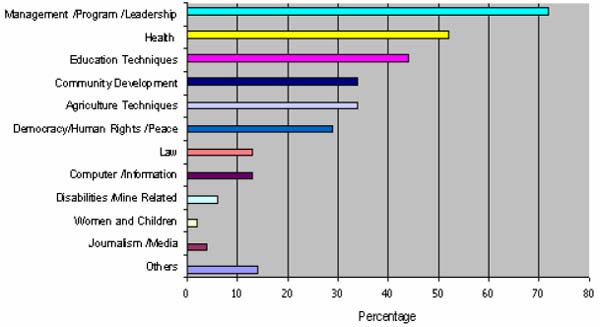
47. The open ended question about capacity development problems, issues and gaps that were being addressed by the external partners was not really answered by the multilateral and bilateral respondents to the survey. In the case of NGOs, seventy percent of the respondent NGOs have indicated that their projects, interventions, and training efforts were aimed at addressing critical gaps in the management, program planning and leadership across almost all sectors and issues of NGO involvement. Health, including HIV/AIDS, accounted for 52% and Education for 44% of the capacity building efforts. Building social capital through community development, democracy and human rights awareness and activities accounted for more than one-third of the responses each. The remaining answers reflected the diverse areas of NGO programming and interventions including strengthening the rule of law, English language, working with vulnerable groups such as the disabled, women and children to name a few.
48. In the interview process few comments were made by bilateral and multilateral donors on the general issue of capacity development. One comment indicated that donors make too many uncoordinated demands about evaluation, monitoring, reporting, etc., which in fact limit Cambodian capacity to manage their own problems. “There is a huge demand on a small number of people to answer questions which only interest our headquarters”. Another comment was: “We impede capacity building by doing the job of Cambodia for them. It would be better to step out and let them learn by doing their own mistakes”. The same commentator added: “There are no indicators for capacity building. One indicator might be the extent to which Cambodians are ready to talk back to donors.” On the other hand a senior Cambodian official, indicated that the transfer of knowledge is beginning to show its effects: “counterparts have taken over the task of developing and managing projects”. 49. Also a related issue was addressed by many donors in the interviews, namely the question of “ownership”. Some donors expressed the view that “there is little feeling of ownership on the Cambodian side and the international experts have to keep pushing”. One donor expressed the feeling in this manner: “There is no militancy on national ownership. The aid community is very hands on. It tends to weaken the responsibility of the government. Cambodia needs leadership, ownership and accountability”. Still another donor stated his views in the following way: “Donors drive the government rather than – as it should be – the other way round. It is a neo-colonial attitude. If we want the government to be accountable we have to give responsibility to the government”. |
|||||||||||||||||||||||||||||||||||||||||||||||||||||||||||||||||||||||||||||||||||||||||||||||||||||||||||||||||||