|
|
 |
 |
 |
||
|
|
|
|
|
|
|
||
|
|
|
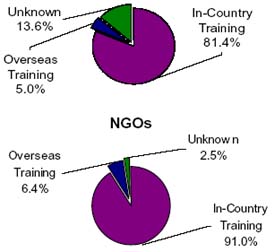
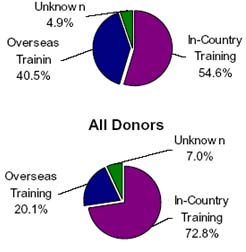
4.2.1 RESULTS OF THE SURVEY 50. A total of 31.4 million US dollars is reported to have been spent on training in 2002 in the implementation of the 147 multilateral and bilateral donors programs and projects and by the 77 NGOs who have responded to the CBP Survey - representing 11.8 percent of their total expenditure recorded in the survey for 2002. A breakdown of the reported expenditures on training (Table 6) reveals that nearly three quarter of the reported expenditure by all development partners, 72.8 percent, takes place in-country. Of this in-country training only 1.1 percent is spent on degree programs for staff or partners. However, there are significant differences among the multilateral, bilateral donors and NGO supported activities. In-country training accounts for 91 percent of the expenditure on training in the case of NGOs, 81.4 percent in the case of multilateral donors and 54.6 percent in the case of bilateral donors.
TABLE
6: EXPENDITURE ON IN-COUNTRY AND OVERSEAS TRAINING IN 2002
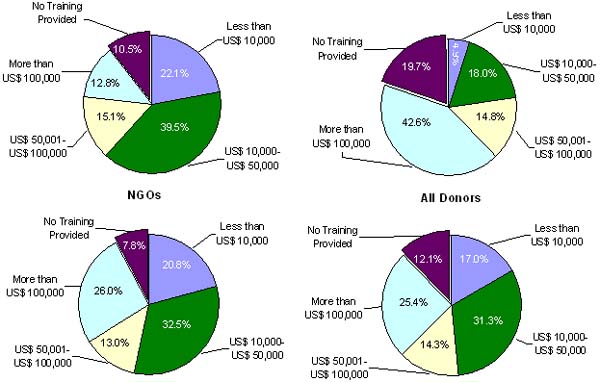
51. Overall, just over 20 percent or around 6.3 million US dollars of the reported total expenditure on training was on overseas training. Most of this expenditure on overseas training, nearly 90 percent, was for non-degree training programs. There are significant variations across the multilateral, bilateral and NGOs in their support for overseas training. A much higher proportion of the total expenditure on training is spent on overseas training by bilateral donors– 40.5 percent – than by NGOs (6.4 percent) or multilateral donors (5.0 percent). Of the total expenditure on overseas training reported in the CBP Survey, 6.3 million US dollars, 83.6 percent concerns programs/projects supported by bilateral donors. 52. Total expenditure on degree programs is reported to be under one million US dollars, representing 3.1 percent of total expenditure on training. Around one-third of the expenditure on degree programs is for in-country training and two-thirds on degree programs abroad. Bilateral donors are the largest supporter of degree programs abroad and multilateral donors the largest supporter of in-country degree programs. In the case of NGOs, the overall numbers and level of expenditure for degree programs is quite small indicating that this is not a priority capacity building practice of NGO programs. The low emphasis put by NGOs on degree programs is likely a reflection of the nature of NGOs approach to their capacity building programs. NGOs tend to build and support institutions, systems, skills and people at the grassroots level through short term training and continuous follow up activities. 53. Overall, training expenditure of up to 50,000 US dollars by a program or project have been reported by 48.3 percent or nearly half of the programs/projects. Another 25.4 percent have reported training expenditure of more than 100,000 US dollars (Table 7). A much higher proportion of bilateral donors have reported training expenditures of over 100,000 US dollars (42.6 percent) than NGOs (26.0 percent) and multilateral donors (12.8 percent). In the case of multilateral donors and NGOs, the highest proportion of respondents have reported training expenditures in the range of 10,000 – 50,000 US dollars, 39.5 percent and 32.5 percent, respectively. TABLE 7: RANGE OF TRAINING EXPENDITURES ON DONOR SUPPORTED PROJECTS
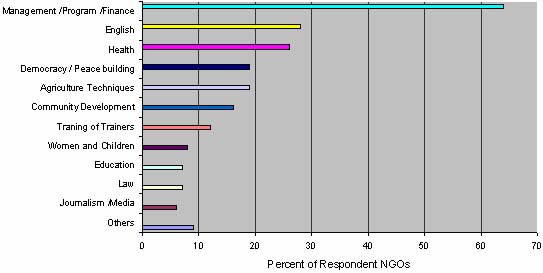
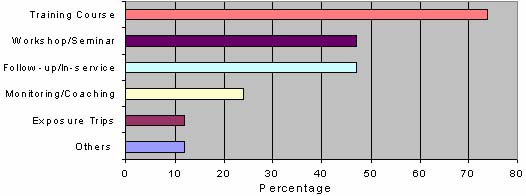
54. A higher proportion of NGOs, 92.2 percent, provide support for training than either multilateral (89.5 percent) or bilateral (80.3 percent) donors (Table 7). 55. The external development partners of Cambodia support and provide various types of training activities on a wide range of topics and subject matters. The training activities are generally related to the area of focus of the program/project and/or the focus of the NGO. In the case of NGOs, 70 percent of the respondent NGOs identified gaps and problems in the areas of management, leadership and program development as the main capacity development issues that they are addressing. Not surprisingly, 64 percent of the NGOs have reported that they support and/or provide training activities in the same areas. English language training is still supported by many NGOs though it was not necessarily identified as an important capacity development issue for the NGO program. However, written communication skills are considered important and much of the training provided in this area is seen as a support function for the overall program. Other areas of training include: health, democracy/peace building, agriculture techniques, community development, and women and children. (Figure 12).
56. Short training courses and workshops are the most common training activity supported by NGOs, followed by short 1-3 day workshops and seminars. Follow up activities and monitoring and coaching were noted as critical informal capacity building techniques but these are often very difficult to quantify or measure in strict financial terms as the costs are spread out among staff, program activities and training.
57. In the case of multilateral and bilateral development partners, few respondents have provided details on their training activities. Of the 147 programs/projects reported in the CBP Survey, 31 percent reported providing support for training in the areas of management, procurement and Finance, 17 percent on health related topics, and under 12 percent in economic development/management. In terms of the type of training activities supported, over 60 percent of the programs/projects of the multilateral and bilateral donors have reported providing some type of training course. Workshops, seminars, and conferences were organised by 17 percent. 58. In terms of the distribution of expenditure on training by sector, the multilateral donors spent nearly 60 percent on multi-sector programs/projects and 10.1 percent each in two sectors: social development and health (Table 8). The agriculture, forestry and fisheries, area/rural development, and the education sectors combined accounted for another 12.7 percent. In the case of bilateral donors, the three sectors that accounted for more than one-half of the bilateral donors expenditure on training were: agriculture, forestry and fisheries (19.4 percent), health (18.1 percent) and education (17.3 percent).
TABLE
8: EXPENDITURE ON IN-COUNTRY AND OVERSEAS TRAINING BY SECTOR IN 2002
|
||||||||||||||||||||||||||||||||||||||||||||||||||||||||||||||||||||||||