 |
 |
 |
 |
||
|
|
|
The Data Collection and Validation Exercise
The Data Collection Exercise
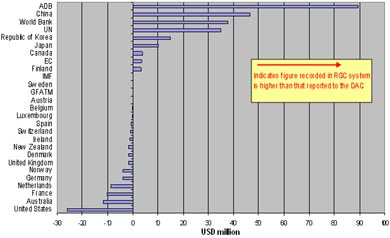
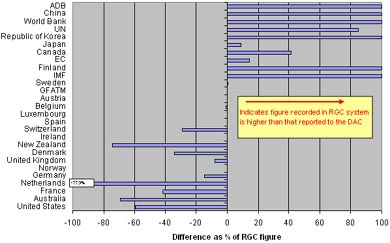
One important conclusion related to the data collection exercise is that very few partners appear to have information systems in place that permit ready access to information on the projects that they finance. To promote more effective aid management in the context of the NSDP, it would be useful to work in partnership to identify the features of such a system and to make use of Cambodia's participation in the OECD/DAC Working Party on Aid Effectiveness to ensure the cooperation of donor capitals or regional offices, who's support is often required in reporting on routine project activity. A second conclusion is that much more work needs to be done by both Government and development partners if the Paris Declaration and the whole aid effectiveness agenda is to be applied. This lack of awareness in many development partner offices goes some way to explaining the paradox of many development partners being vocally committed to the H-A-R Action Plan at a senior level while the reality of the practices employed in their programmes and projects is perhaps somewhat different. The final conclusion relates to the management of data and information systems across Government. In the context of on-going reforms and associated sector/thematic work, it will be important to simplify and harmonise the collection and sharing of data. Multiple data collection exercises are not only inefficient but they can also lead to conflicting sets of data being used for programming or reporting purposes. Harmonising both data collection processes and the calendar for collecting information is one potential option to be explored, including for the PIP and Budget exercises. The Questionnaire It is necessary to consider in more detail some of the problems experienced in completing the questionnaire so that these issues can be addressed in future rounds, either by revising the questionnaire or providing more training. Some parts to the questionnaire were found to be particularly prone to error and misunderstanding, or else the data simply was not available. This applies in particular to the use of technical cooperation, i.e. the distinction between Free-Standing Cooperation and Investment-related Technical Cooperation, as well as the recording of the use of project staff. Additional misunderstanding was common in the recording of government implementers and the association of a project with a Program-based Approach (PBA), with some partners believing that if their project was part of a sector that had established a PBA then their support was automatically associated with it. A further example relates to the recording of Paris Declaration indicators, which was discussed in the previous Section. Further complications arose as some development partner focal points do not have complete information, especially for NGO implemented projects, and the questionnaires need to be sent to the project/program implementer. This implies that more time, or a more routine data collection exercise, are required, while the Manual must be updated to elaborate on the Glossary of Terms and to provide clearer guidance to the user. Overall, this experience raises important questions about the Government's ability to exercise full ownership of development assistance when there are such prevalent misconceptions, or a lack of routine data systems for providing information on the provision of strategic resources such as technical cooperation. Is it ODA? The CDC Database attempts to present a full picture of all external flows. This includes those flows considered to be Official Development Assistance but also other flows that are intended for the non-official sector (which are technically not defined as ODA) or which are sourced from the non-official sector. The Database therefore captures a wider range of external flows than just ODA. As explained below, this is one of the reasons why the data in the system is in some case different from that collected by the OECD/DAC and recorded in their Creditor Reporting System (CRS). How good is our data? Before policy measures can be prescribed, it is necessary to consider the quality of the data that has been used in the preparation of this Report. The starting point is to take a macro view that compares data collected in Cambodia to that of the most reputable global source for ODA data, i.e. the OECD/DAC Creditor Reporting System (CRS). Although data for 2006 is not yet available in the CRS, figures from 2005 can be compared to provide a useful insight into the quality of the data. The charts below show disbursements by Cambodia's main multilateral and bilateral development partners, recorded by both the OECD/DAC and the CDC Database. Key points to note are:
|
|
Discrepancies in 2005 ODA Disbursement Reporting (CDC data – DAC CRS figure) |
|
| Absolute differences (USD million) | Relative differences (per cent) |
 |
 |
|
Source: CDC and DAC CRS Databases (CDC data is April 2007 and may not be final numbers submitted by partners) While these numbers compare development partners aggregate disbursements, it should also be noted that total 2005 disbursements to Cambodia recorded by CDC (USD 610 million) are significantly higher than the figure recorded by the DAC (USD 392.3m), even once the DAC non-reporting donors are accounted for, as NGO disbursements from their own sources are recorded in the Database; in 2005 these were estimated to be USD 44.7m. The comparison of aggregate datasets leads to the conclusion that the CDC database captures significantly more funding than the CRS system and, although this is not without its problems, it means that it is likely that the CDC dataset presents a more complete, and therefore more accurate, picture regarding the availability of external support. The next step in considering aggregate data quality is to consider data consistency over a longer period of time. To do this, those 15 development partners who report to both CDC and the DAC can be extracted from the data set and analysed separately over an extended time period. It can be seen in the chart below, that the aggregate disbursement trends move quite closely together, although the within-year discrepancy between the CDC and DAC figures can be as large as USD 50 million. There does not appear to be any systematic relationship in the deviation, however, as in 2002 the CDC Database recorded approximately 20% higher disbursements than the DAC, but this was reversed in 2005. Analysing development partners on a like-for-like basis (comparing the discrepancies for a single partner), the correlation coefficients between their annual disbursements is remarkably high (this is shown in the table to the right of the chart, below). Movements and trends in the respective CDC and DAC datasets on individual partners in individual years are therefore broadly similar, which indicates that the data is of a relatively robust nature even if there are some aggregate discrepancies.
Source: CDC and DAC CRS Databases (showing aggregate disbursement data for Australia, Belgium, Canada, Denmark, EC, France, Germany, GFATM, Japan, Netherlands, New Zealand, Switzerland, Sweden, United Kingdom, United States) The final consideration with regard to data quality is to move away from an aggregate comparison of disbursements to look more closely at the data reported by each individual development partner. One of the main problems that manifests itself at an aggregate level concerns the number of partners who do not appear to know which sector their support is directed to (USD 42 million, or 6.9% of all disbursements, are categorised as 'other' sector despite multiple sector selections being permitted) or to the correct identification of implementing partner (either Government or NGO). The data is robust for policy analysis Given that: (i) the CDC dataset contains more information from more development partners; (ii) across time there is a close correlation between development partner disbursement data in the DAC and CDC datasets; and (iii) the data in the CDC Database, especially the non-financial data, has been cleaned relatively thoroughly, it is possible to conclude that the data used for this Aid Effectiveness Report is of a sufficiently robust nature to inform policy analysis. As the Government and its partners progress on the path toward 'managing for development results' and a more evidence-based aid management, however, additional attention should be paid to improving the quality and coverage of the data. Measures to improve data collection and quality There are a number of relatively straightforward practices that can be either strengthened or established to improve the quality of the data and the analysis. It must be emphasised that these practices would not be intended as an end in themselves; they would be directly associated with the effort to improve aid management at an aggregate level with commensurate benefits to NSDP implementation. These potential practices include:
Future Data Collection Exercises Adopting an 'enter as you go' approach will also reduce the intensity of the annual exercise to report on disbursements, allowing for that period to be used for training, awareness raising and a more strategic dialogue on the manner in which the data can inform the 'managing for results' effort. Efficiencies in data collection might also be pursued within Government as data collection exercises can be combined and more use made of data sharing, for example in producing the Sector Profiles that are presented in Chapter Two.
|
||||||||||||||||||||||||