|
|
 |
 |
 |
||
|
|
|
|
|
|
|
||
|
|
|
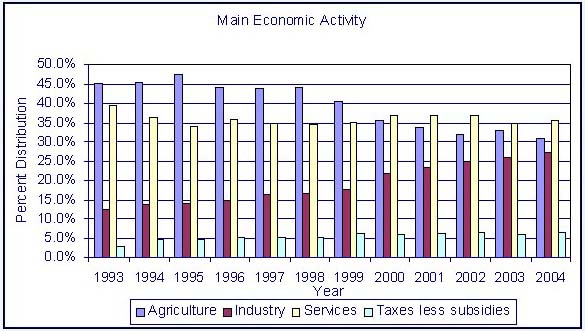
2. ECONOMIC PERFORMANCE 8. The RGC’s focused efforts to strengthen macroeconomic management and the implementation of the fiscal reforms have resulted in robust economic performance in 2004 and 2005, in spite of negative external factors such as higher oil price, SARS epidemic and concerns about the on-going avain flu, and adverse weather conditions in 2004. In 2004, real GDP grew by 7.7 percent, as compared to the revised GDP growth of 7.0 percent in 2003 and 5.2 percent in 2002. The preliminary estimate indicates that the economy grew by 7 percent in 2005, reflecting stronger growth in the agriculture sector, continued expansion of exports, tourism and construction activities. The estimated nominal GDP for 2004 was 19,630 billion CRs (approximately US$ 4.9 billion).The inflation rate increased to 5.6 percent in 2004, mainly because of higher oil prices and higher rice prices due to drought along with price increases in the international market. In 2005, the continuing higher fuel prices have negatively impacted on all sectors, consumers, producers, and the government as well, and have pushed inflation up to about 6 percent. Gross international reserves have remained equivalent to around 2.5-2.7 months of import coverage in 2004 and 2005. Sharp fluctuations in the global currency markets also threw shadows on local foreign exchange market, as the riel-US dollar exchange rate became somewhat weaker in 2005 compared with the previous year. The riel depreciated year-on-year by about 2 percent in December 2005 as compared to a 1 percent depreciation in the same period of last year, though this rate is still within a manageable range. 9. In terms of the contribution of the main economic sectors to overall GDP, in current prices, the agriculture, fisheries and forestry sector in 2004 accounted for 31.1 percent of GDP compared with 45.1 percent in 1993. The contribution of industrial sector continues to grow, more than doubling from 12.7 percent in 1993 to 27.5 percent in 2004, due to the rapid expansion in the textile, wearing apparel and footwear industry and continued strong construction activity. Although there has been significant growth in tourist oriented services sector, as a result of the rapid expansion in the industry sector, the share of the services sector in total GDP has declined from 39.5 percent in 1993 to 35.8 percent. 10. Due to drought, late floods and declining forestry production, the output of the agriculture, fisheries and forestry sector declined in 2004 by 2.0 percent as compared to an increase of 12.2 percent in 2003. Crops and fisheries gross value added declined 3.4 and 3.3 percent, respectively. Gross value added for inland and marine fish catch continue to trend downwards, with decreases of 4.6 and 7.8 percent respectively in 2004. The livestock and poultry grew by 4.3 percent. In the forestry and logging sector gross value added increased slightly, by 0.2 percent, in 2004. The turn around is due mainly to the strong growth in logging for timber for use in domestic construction and furniture manufacturing, offset by the continuing decline in illegal logging for export. Agricultural production grew by 4.5 percent in 2005, led by a 20 percent rebound in rice production. 11. The industry sector grew by 16.1 percent in 2004, as compared to 11.9 percent in 2003. The sector is dominated by manufacturing (75.4 percent) and construction (22.0 percent). Textile, wearing apparel and footwear manufacturing value added increased by 24.9 percent in 2004, following increases of 16.9 percent and 21.2 percent in 2003 and 2002 respectively. Exports in GSP products, mainly manufactured garments, have grown from 82.6 percent of Cambodia’s total goods exports in 2003 to 88.8 percent in 2004. Construction value added also contributed strongly to 2004 growth, increasing by 13.2 percent compared to increases of 11.1 percent and 27.1 percent in 2003 and 2002 respectively. In 2005, the industrial sector grew by 10.7 percent, reflecting the continuing strength of the garment manufacturing sector that grew by 10.2 percent and the construction sector that grew by 13 percent. The value of garments exported increased from US$ 1.98 billion in 2004 to US$ 2.17 billion in 2005. 12. The services sector grew by 9.2 percent in 2004, as compared to 0.2 percent in 2003. Tourism continues to be the main contributor to growth in the services sector, with travel receipts from overseas tourists increasing by 50.4 percent in 2004. Tourists from overseas helped to contribute to growth in the hotel and restaurant industry (23.6 percent); transport and communications industry (6.2 percent); and other services (18.5 percent). In 2005, the services sector grew by 6.2 percent in real terms, with value added by hotels and restaurants increasing by 15 percent. GDP by Main Economic Activity in Current Prices
13. Estimated nominal
per capita GDP in 2004 was 1.435 million CRs, an increase of 11.2
percent from 2003. It has grown at an average annual rate of 6.7 percent
over the last four years. Population growth during the same period has
averaged 1.9 percent per annum. In real terms, GDP per capita was 1.319
million CRs in 2004, an increase of 5.6 percent from 2003. Real growth
in GDP per capita has averaged around 4.4 percent over the last four
years. Per capita GDP in US dollars has shown reasonable real annual
growth of 4.6 percent in 2004, increasing to US$ 328, compared to 3.6
and 3.4 percent in 2003 and 2002 respectively. Nominal GDP per capita
increased from US$ 325 in 2003 to US$ 357 in 2004. 15. In 2005, total domestic revenues are expected to increase to 2,591 billion CRs (approximately US$ 629.2 million) from 2,212 billion CRs (US$ 550.7 million) in 2004, and 1776 billion CRs (US$ 446.7 million) in 2003. In 2005, domestic revenues collected consisted of 1,929 billion CRs in tax revenues, 555 billion CRs in non-tax revenues, and 106 billion CRs in capital revenues from privatization and other sources. 16. In 2004, total domestic revenue collected consisted of 1,648 billion CRs in tax revenues, 544 billion CRs in non-tax revenues, and 19 billion CRs in capital revenues from privatization and other sources. 17. In both 2004 and 2005, overall, the Royal Government has managed to contain total expenditure below targets, thus minimizing the need for domestic financing. In both years, total current public expenditures were lower than total domestic revenues collected both in nominal terms and as a percent of GDP. Total current expenditures decreased from 10.6 percent of GDP in 2003 to 9.5 and 9.3 percent in 2004 and 2005 (preliminary estimate). 18. In 2004, expenditures processed through the National Treasury totaled approximately 2,078.8 billion CRs (US$ 515.7 million). These included 1,745.7 billion CRs (US$ 433.1 million) on current expenditures, and 333.1 billion CRs (US$ 82.6 million) on capital/ development expenditures that were financed from domestic sources and channeled through National Treasury. The total capital expenditure in 2004, from both domestic and external sources, was estimated to be 1,260.6 billion CRs (US$ 312.7 million). 19. In 2004, the composition of the total current expenditure of 1,745.6 billion CRs on civil administration, defense and security, and interest on loan, was as follows:
20. The preliminary data on expenditures in the first eleven months of 2005 show that expenditures processed through the National Treasury totaled approximately 1,789,791 billion CRs. These included 1,475,767 billion CRs on current expenditures, and 314 billion CRs on capital/development expenditures that were financed from domestic sources and channeled through the National Treasury. The total capital expenditure during this period, from both domestic and external sources, was estimated to be 950 billion CRs. 21. The composition of
the total current expenditure of 1,475.8 billion CRs in the first eleven
months of 2005 on civil administration, defense and security, and
interest on loan, was as follows:
22. Since 1993, overall economic performance has been quite impressive. Between 1993 and 2004, real GDP (in 2000 prices) has grown at an average annual rate of 7.1 percent, and preliminary estimates indicate that it grew by 7 percent in 2005. There has also been a sharp and noteworthy reduction in poverty levels. The results of the 2004 Cambodia Socio-Economic Survey show that in 56 percent of the rural villages accounting for 65 percent of the rural population and urban areas that were included in same survey in both 1993 and 2004 -- the number of persons living below poverty line declined from an estimated 39 percent to 28 percent or by over 28 percent. The 1993 survey did not cover areas where Khmer Rouge soldiers were still active. 23. In a recent study on
"Cambodia Poverty Assessment 2005" prepared by World Bank an attempt was
made to develop an estimate of the poverty level in 1993 for the whole
country by making backward projections based on data from the 1993 and
subsequent surveys. Based on these backward extrapolations the study
estimated the proportion of population living below the poverty line in
1993 to be 47 percent. Based on this estimate of the poverty level in
1993, the study concluded that population living below the poverty line
has declined from 47 percent in 1993 to 35 percent in 2004. It found
that, "as average household consumption has risen, Cambodians now have
more productive assets and consumer durables and live in better houses.
The improvement in living standards has been experienced by the poorest
quintile (that is, the poorest 20 percent of the population) as well as
the richest quintile -- albeit to a much lesser degree. Similarly,
poverty has fallen in the countryside as well as the towns, although the
fall has been far greater, and the level of poverty is now far lower, in
the towns". |
|