|
|
 |
 |
 |
||
|
|
|
|
|
|
|
||
|
|
|
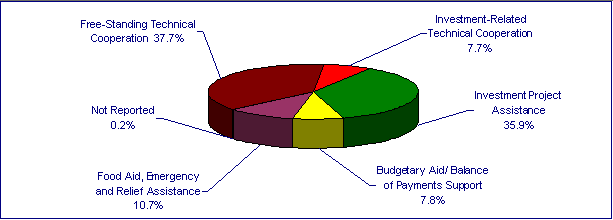
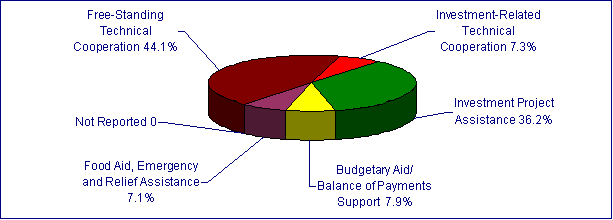
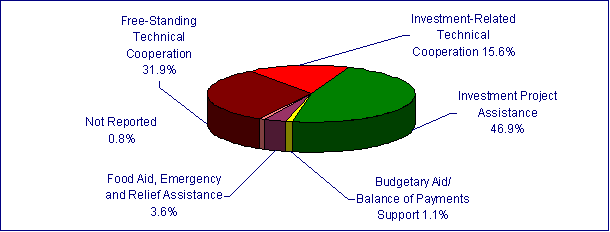
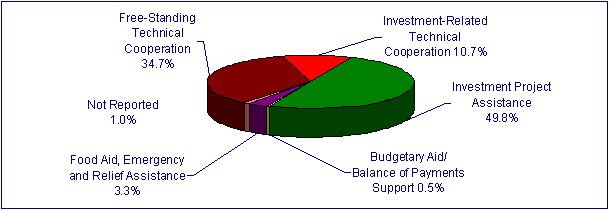
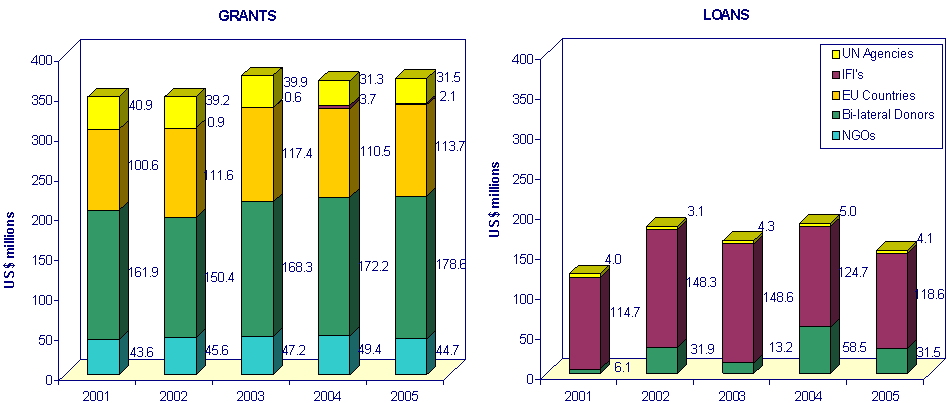
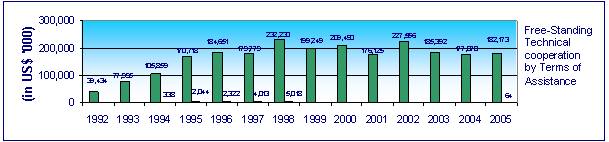
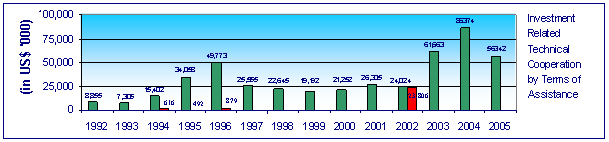
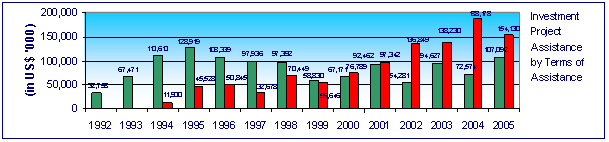
38. Over the period of 1992-2005, the composition of ODA by "type of assistance" has changed significantly. The share of "free-standing technical cooperation" increased from 20.5 percent of total ODA received in 1992 and 1993, to 40.2 percent in the 1994-98 period, and 44.1 percent during 1999-2003. In 2004, it is reported to have declined to 31.9 percent of total disbursements and increased again in 2005 to 34.7 percent of total disbursements. The share of "investment project assistance" in total ODA has steadily increased from 17.5 percent in 1992 and 1993, to 34.2 percent over 1994-98, and 36.2 percent of total ODA during 1999-2003. In 2004 and 2005, this type of assistance accounted for 46.9 percent and 49.8 percent of total disbursements. It should be noted, however, that a large share of "investment project assistance" was financed through loans: 57.9 percent of this type of assistance in 1999-2003, 72.2 percent in 2004, and 59 percent in 2005.
TABLE 8: DISBURSEMENTS BY TYPE AND TERMS OF ASSISTANCE |
| Type of Assistance |
Terms |
1999-2003 US$ % | 2004 US$ % |
2005 US$ % |
TOTAL 1992-2005 Disbursements US$ % |
||||
|
Free-Standing Technical Cooperation |
Grants Loans TOTAL |
997.8 0.0 997.8 |
44.1 0.0 44.1 |
177.1 0.0 177.1 |
31.9 31.9 |
182.2 0.1 182.2 |
34.7 0.0 34.7 |
2,347.7 13.8 2,361.5 |
37.5 0.2 37.7 |
|
Investment-Related Technical cooperation |
Grants Loans TOTAL |
152.4 23.8 176.2 |
6.3 1.0 7.3 |
86.4 0.0 86.4 |
15.6 15.6 |
56.3 56.3 |
10.7 10.7 |
458.7 25.8 484.5 |
7.3 0.4 7.7 |
|
Investment Project Assistance |
Grants Loans TOTAL |
367.4 504.9 872.2 |
15.3 21.0 36.2 |
72.6 188.2 260.8 |
13.1 33.9 46.9 |
107.1 154.1 261.2 |
20.4 29.4 49.8 |
1,190.5 1,058.6 2,249.0 |
19.0 16.9 35.9 |
|
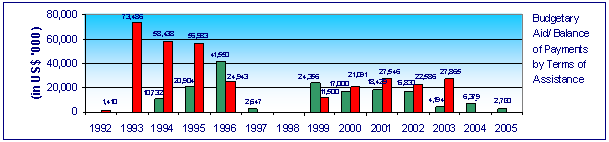
Budgetary Aid/ Balance of Payments Support |
Grants Loans TOTAL |
80.8 110.6 191.4 |
3.4 4.6 7.9 |
6.4 0.0 6.4 |
1.1 1.1 |
2.7 2.7 |
0.5 0.5 |
165.7 325.8 491.6 |
2.6 5.2 7.8 |
|
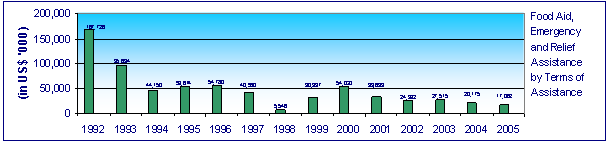
Food Aid, Emergency and Relief Assistance |
Grants Loans TOTAL |
171.1 0.0 171.1 |
7.1 0.0 7.1 |
20.2 0.0 20.2 |
3.6 3.6 |
17.1 17.1 |
3.3 3.3 |
670.4 0.0 670.4 |
10.7 10.7 |
|
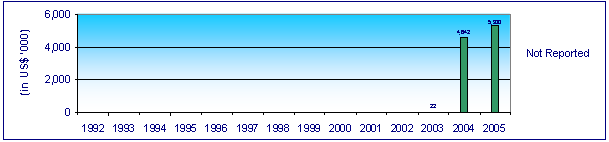
Not Reported |
Grants Loans Total |
0.0 0.0 0.0 |
0.0 0.0 0.0 |
4.6 0.0 4.6 |
0.8 0.8 |
5.3 5.3 |
1.0 1.0 |
10.0 0.0 10.0 |
0.2 0.2 |
|
Total Disbursements |
Grants Loans TOTAL |
1,769.5 639.2 2,408.8 |
73.5 26.5 100.0 |
367.2 188.2 555.4 |
66.1 33.9 100.0 |
370.7 154.2 524.9 |
70.6 29.4 100.0 |
4,843.0 1,424.0 6,267.0 |
77.3 22.7 100.0 |
| Type of Assistance | Terms of Assistance |
2001 Actual US$ % |
2002 Actual US$ % |
2003 Actual US$ % |
2004 Actual US$ % |
2005 Provisional US$ % |
2001-2005 Total Disbursements US$ % |
||||||
|
Free-Standing Technical cooperation |
Grants Loans TOTAL |
176.1
0 176.1 |
37.3
0 37.3 |
227.6
0 227.6 |
42.9
0 42.9 |
185.4
0 185.4 |
34.4
34.4 |
177.1
0.0 177.1 |
31.9
31.9 |
182.2
0.1 182.2 |
34.7
0.0 34.7 |
948.3 0.1 948.4 |
36.2
0.0 36.2 |
|
Investment-Related Technical cooperation |
Grants Loans TOTAL |
26.3
0 26.3 |
5.6
0 5.6 |
24.0
23.8 47.8 |
4.5
4.5 9.0 |
61.7
0.0 61.7 |
11.4
11.4 |
86.4
0.0 86.4 |
15.6
15.6 |
56.3
0.0 56.3 |
10.7
10.7 |
254.7
23.8 278.5 |
9.7
0.9 10.6 |
|
Investment Project Assistance |
Grants Loans TOTAL |
92.5
97.3 189.8 |
19.6
20.6 40.2 |
54.3
136.8 191.1 |
10.2
25.8 36.0 |
94.6
138.2 232.9 |
17.5
25.6 43.2 |
72.6
188.2 260.8 |
13.1
33.9 46.9 |
107.1
154.1 261.2 |
20.4
29.4 49.8 |
421.0
714.7 1,135.8 |
16.1
27.3 43.3 |
|
Budgetary Aid/ Balance of Payments Support |
Grants Loans TOTAL |
18.4
27.5 46.0 |
3.9
5.8 9.7 |
16.8
22.6 39.4 |
3.2
4.3 7.4 |
4.2
27.9 32.1 |
0.8
5.2 5.9 |
6.4
0.0 6.4 |
1.1
1.1 |
2.7
0.0 2.7 |
0.5
0.5 |
48.5
78.0 126.5 |
1.9
3.0 4.8 |
|
Food Aid, Emergency and Relief Assistance |
Grants Loans TOTAL |
33.6
0 33.6 |
7.1
0 7.1 |
25.0
0 25.0 |
4.7
0 4.7 |
27.5
0.0 27.5 |
5.1
5.1 |
20.2
0.0 20.2 |
3.6
3.6 |
17.1
0.0 17.1 |
3.3
3.3 |
123.4
0.0 123.4 |
4.7
4.7 |
|
Not Reported |
Grants Loans TOTAL |
0
0 0 |
0
0 0 |
0
0 0 |
0
0 0 |
0.0
0.0 0.0 |
0.0
0.0 0.0 |
4.6
0.0 4.6 |
0.8
0.0 0.8 |
5.3
0.0 5.3 |
1.0 1.0 |
10.0
0.0 10.0 |
0.4
0.0 0.4 |
|
Total Disbursements |
Grants Loans TOTAL |
347.0
124.9 471.8 |
73.5
26.5 100.0 |
347.7
183.2 530.9 |
65.5
34.5 100.0 |
373.4
166.1 539.5 |
69.2
30.8 100.0 |
367.2
188.2 555.4 |
66.1
33.9 100.0 |
370.7
154.2 524.9 |
70.6
29.4 100.0 |
1,805.9
816.6 2,622.5 |
68.9
31.1 100.0 |
|