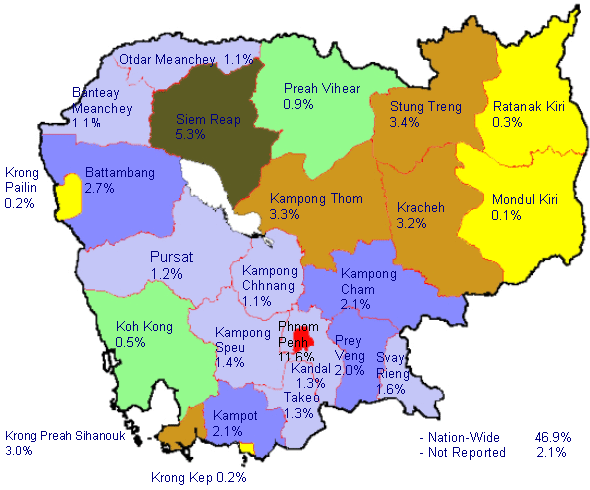
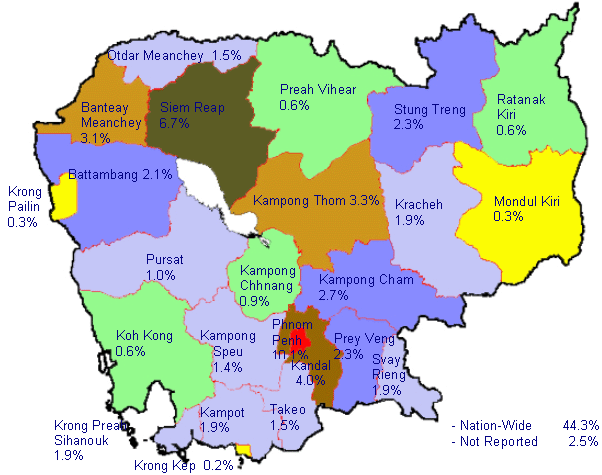
|
3.7
DISBURSEMENTS BY PROVINCE IN 2004 AND
2005
49. The Royal Government needs
reliable information on the regional distribution of the ODA to ensure
that ODA supported activities are in line with the Government's regional
development priorities. This the second time that the Cambodian
Rehabilitation and Development Board of the Council for the Development
of Cambodia (CDC/CRDB) has attempted to collect information on the
geographic location of the activities/beneficiaries of ODA supported
activities. As compared to previous survey the development cooperation
partners have reported information the geographic location of their
programs activities for the years 2004 and 2005.
Table 14: ODA
Disbursements by Province: 2004 & 2005
|
PROVINCE |
DISBURSEMENTS in thousands of US$ |
|
2004 |
2005 |
|
US$ |
% |
US$ |
% |
|
Banteay Meanchey |
5,935 |
1.1% |
16,523 |
3.1% |
|
Battambang |
15,227 |
2.7% |
11,272 |
2.1% |
|
Kampong Cham |
11,615 |
2.1% |
14,351 |
2.7% |
|
Kampong Chhnang |
5,950 |
1.1% |
4,971 |
0.9% |
|
Kampong Speu |
7,865 |
1.4% |
7,546 |
1.4% |
|
Kampong Thom |
18,089 |
3.3% |
17,084 |
3.3% |
|
Kampot |
11,701 |
2.1% |
10,020 |
1.9% |
|
Kandal |
7,243 |
1.3% |
21,005 |
4.0% |
|
Koh Kong |
2,781 |
0.5% |
3,208 |
0.6% |
|
Kracheh |
17,676 |
3.2% |
10,005 |
1.9% |
|
Mondul Kiri |
553 |
0.1% |
1,409 |
0.3% |
|
Phnom Penh |
64,206 |
11.6% |
53,162 |
10.1% |
|
Preah Vihear |
5,166 |
0.9% |
3,112 |
0.6% |
|
Prey Veng |
11,209 |
2.0% |
12,235 |
2.3% |
|
Pursat |
6,618 |
1.2% |
5,253 |
1.0% |
|
Ratanak Kiri |
1,902 |
0.3% |
2,936 |
0.6% |
|
Siem Reap |
29,436 |
5.3% |
35,020 |
6.7% |
|
Krong Preah Sihanuk |
16,490 |
3.0% |
9,713 |
1.9% |
|
Stung Treng |
18,992 |
3.4% |
12,068 |
2.3% |
|
Svay Rieng |
8,817 |
1.6% |
9,894 |
1.9% |
|
Takeo |
7,264 |
1.3% |
8,009 |
1.5% |
|
Otdar Meanchey |
6,144 |
1.1% |
7,862 |
1.5% |
|
Krong Kep |
857 |
0.2% |
879 |
0.2% |
|
Krong Pailin |
1,345 |
0.2% |
1,678 |
0.3% |
|
Nation-Wide |
260,412 |
46.9% |
232,734 |
44.3% |
|
Not Reported |
11,901 |
2.1% |
12,914 |
2.5% |
|
TOTAL |
555,392 |
100.0% |
524,862 |
100.0% |
|


