|
|
 |
 |
 |
||
|
|
|
|
|
|
|
||
|
|
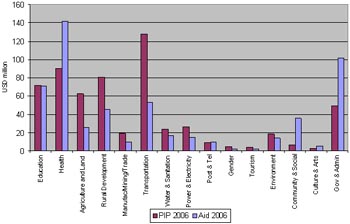
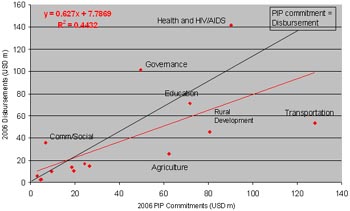
| Source: PIP 2006 (data on 2006 commitments) and CDC Database (derived) |
|
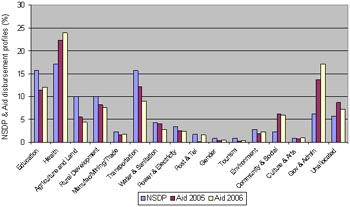
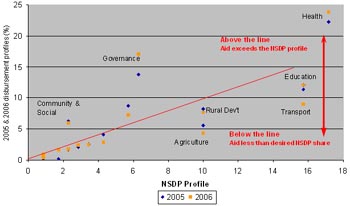
The final piece of analysis compares 2005 and 2006 actual disbursement profiles to the NSDP profile. This comparison, presented in Chart Six below, shows that in both 2005 and in 2006 health, governance and community and social services were over-funded relative to the profile envisaged in the NSDP. By contrast, transportation, education, rural development and agriculture are again confirmed to be significantly under-funded in both years. The remaining sectors, in both 2005 and 2006, are located very close to the red line that indicates parity between the desired NSDP profile and actual shares of development assistance disbursements. |
| Source: NSDP Table 5.2 and CDC Database (derived) |
|
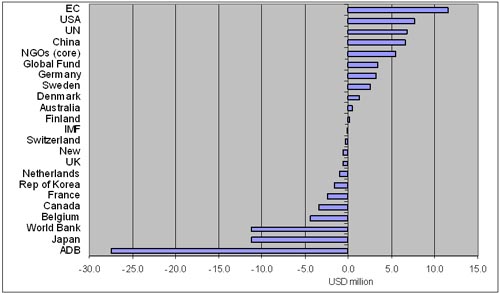
Another CMDG that is currently off-track is water and sanitation, especially in rural areas. It is more difficult to draw conclusions with regard to this activity as rural water supply is not included in the water & sanitation sector presented here (similarly, water-related activities for agriculture are not part of water & sanitation) but the data indicates that this is also a sector that is both relatively under-funded (on a commitments basis) and receiving only about two-thirds of resources indicated in the PIP. It is therefore possible to conclude that alignment of development cooperation is broadly consistent with the NSDP at aggregate and, to a lesser degree, sectoral levels. It is less clear that development assistance is being re-directed toward sub-sectoral priorities that have been shown to have made less progress while important routine under-funding of some NSDP priorities may require a review of NSDP costings and allocations. Understanding the manner in which commitments, which are closely aligned to the NSDP, are not always translated into disbursements will also be an important issue in the context of securing predictable funding to national priority sectors. Development Assistance Disbursements Trends Provisional estimates of annual disbursements reported by development partners in 2006, including the core funds of NGO partners, amount to USD 594.8 million, a decline of USD 15.2 million from the 2005 level or a difference of a little over 2.5%. The introduction of the NSDP in 2006 indicated that the total funding requirement for the five year programme (2006-2010) was USD 3,500 million, implying an annual funding requirement of some USD 700 million. It can therefore be seen that development assistance continues to represent a significant contribution to the funding of national priority development activities, with additional support provided from the Royal Government's own resources. Table Four, below, shows disbursement trends since 2002 while Chart Seven highlights that there is no single source of the decline in development cooperation since 2005. In the context of this small decline, for example, it is notable that ten development partners and NGO core funding recorded an increase in their year-on-year disbursements, including three of the five largest partners, i.e. China, the United States and the combined agencies of the United Nations. This was more than off-set, however, by a significant decline in reported disbursements from ADB, Japan and the World Bank3. Table Four. Development Cooperation: Disbursements 2002 - 2006 (USD million)
Source: CDC Database (end April 2007) The decline in 2006 is a reversal in the steadily upward trend in development cooperation receipts recorded in recent years (see Annex Six for data since 1992). The chart below shows that disbursements had increased from a total of USD 472 million in 2001 to 610 million in 2005, an annual increase of 6.6% per year. It must also be noted, however, that the 2006 figure is provisional and at this stage last year, the provisional figure prepared for the 2005 Development Cooperation Report was USD 524.9 million, compared to the revised 2005 figure of USD 610 million. The 2006 figure may therefore be subject to upward revision at a later time. Chart Seven. Annual Change in Development Cooperation Disbursements 2005-06 (USD million)
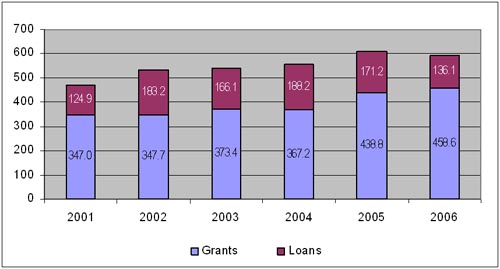
The chart below also shows that USD 136.1 million, or 23.8% of 2006 disbursements, were in the form of concessional loans. This is a decline from the previous year's level of 171.2 million, indeed it is the lowest since 2001 and demonstrates the impact of the increased focus on grant financing by the World Bank and the ADB. Chart Eight. Disbursement Trends 2001 - 2006 (USD million)
The main sectors that benefited from loan finance are shown in Table Five, below, and include transport infrastructure, tourism, rural development and water in addition to a number of social sectors. The Strategic Framework for Development Cooperation Management (paragraph 25) sets out the Royal Government's policy on debt management, emphasising the need to identify grant assistance where possible and to attempt to link loan finance to projects that contribute to economic growth. |
||||||||||||||||||||||||||||||||||||||||||||||||||||||||||||||||||||||||||||||||||||||||||||||||||||||||||||||||||||||||||||||||||||||||||||||||||||||||||||||||||||||||||||||||||||||||||||||||||||||||||||||||||||||||||||||||||||||||||||||||||||
|
Development Partner |
T'port |
Comm'ty & Social |
Rural Devt |
Educ |
Gov. & Admin Reform |
Post & Tele. |
Budget/ |
Power & Elec |
Health |
Water & San |
Environ |
Urban Plan |
Manufac, Mining, Trade |
Tourism |
Agric |
TOTAL |
|
UN Agencies (core) |
|
|
4.09 |
|
|
|
|
|
|
|
|
|
|
|
|
4.09 |
|
World Bank |
2.96 |
|
2.15 |
1.46 |
5.26 |
|
|
1.18 |
2.35 |
2.76 |
0.45 |
|
1.45 |
|
0.004 |
20.03 |
|
ADB |
5.22 |
|
10.8 |
13.06 |
1.28 |
|
8.07 |
4.57 |
2.68 |
2.73 |
2.91 |
1.85 |
|
1.24 |
0.23 |
54.6 |
|
France |
|
|
|
|
|
|
|
|
0.5 |
|
|
|
|
|
|
0.5 |
|
China |
12.2 |
18.79 |
|
|
7.05 |
8.46 |
|
|
|
|
|
|
|
|
|
46.49 |
|
Japan |
4.35 |
|
|
|
|
0.91 |
|
|
|
|
|
|
|
|
|
5.27 |
|
Republic of Korea |
4.38 |
|
|
0.77 |
|
|
|
|
|
|
|
|
|
|
|
5.15 |
|
Total Loans |
29.1 |
18.8 |
17.0 |
15.3 |
13.6 |
9.4 |
8.1 |
5.8 |
5.5 |
5.5 |
3.4 |
1.9 |
1.5 |
1.2 |
0.2 |
136.1 |
|
Total sector disburse |
53.3 |
35.5 |
45.5 |
71.5 |
92.9 |
9.8 |
17.6 |
14.6 |
110.0 |
16.9 |
14.0 |
3.1 |
10.2 |
2.3 |
25.9 |
523.1 |
|
% of sector finance |
54.6 |
53.0 |
37.5 |
21.4 |
14.6 |
96.0 |
46.0 |
39.3 |
5.0 |
32.4 |
24.1 |
58.9 |
14.2 |
53.7 |
0.9 |
26.0 |
|
% of all 2006 loans |
21.38 |
13.80 |
12.52 |
11.23 |
9.98 |
6.88 |
5.93 |
4.22 |
4.06 |
4.03 |
2.47 |
1.36 |
1.07 |
0.91 |
0.17 |
100.0 |
| Source: CDC Database [Note that UN loan disbursement is made by IFAD] |
|
In addition to receiving sustained levels of support throughout the programme period, the discussion earlier in this section identified the need for the NSDP to be supported in a more efficient manner, including through the use of programmatic modalities possibly augmented by an improved donor division of labour. A third desirable characteristic of development assistance concerns predictability. As the reform programme of the Royal Government proceeds, the national planning and budgeting framework is being strengthened and is increasingly dependent on the provision of more accurate projections of resource availability, both external and domestic. This supports a more coherent and consolidated approach to resource allocation and ensures longer-term sustainability by integrating the recurrent (e.g. road maintenance) and investment (e.g. road construction) components of the National Budget. The need for predictability, which was highlighted as a concern in the section on alignment, is emphasised in the global aid effectiveness work and is included as an indicator for monitoring the Paris Declaration (see the discussion in Chapter Four of this Report). In addition to a consideration of PIP commitments and actual disbursements, highlighted earlier in this chapter, the data for Cambodia allows some analysis of the available funding indicated at the Consultative Group and then actually disbursed. It must be noted that while the table provides some insight into the predictability of funding this analysis can be somewhat obscured by the observation that commitments made at the Consultative Group are not always associated with a particular calendar year and some pledges are associated with existing undisbursed commitments. It is further noted that the amounts communicated in these high-level dialogue meetings are in the future to be considered as purely indicative and, while development partners are requested to provide data that is as accurate as possible, it is acknowledged that assessments of disbursement ratios are also purely indicative. Table Six. Pledges and Disbursements 2005 - 2006 (USD million)
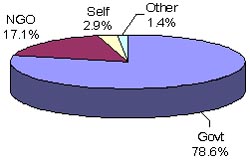
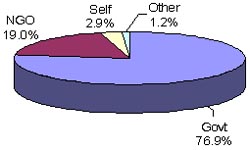
Source: CG Meeting pledging statements and CDC Database. Note: Not all partners pledge. Totals show only disbursements against pledges and associated ratios. For those development partners pledging in their own currencies, the disbursement ratio is affected by US Dollar exchange rate movements. Table Six, above, shows that, after disbursements exceeding pledges in 2005 by nearly 10%, they were almost 13% lower than predicted in 2006. In future years, the Government will use the CDCF meeting and the discussion on NSDP funding to attempt to secure indicative multi-year funding estimates from development partners. These estimates will provide inputs to the National Budget and to the Public Investment Programme. Implementation Arrangements and NGO Funding Partnerships This next section considers the arrangements that are made for implementing externally-funded programmes. Implementation modalities can be an important factor in determining development results and in fostering the national ownership that promotes both shorter-term impact as well as longer-term sustainability. The charts below show that, in the last two years, over three-quarters of development assistance was implemented by Government (including funds channeled via a pooled arrangement between development partners) while a little under 20% was managed by NGOs.
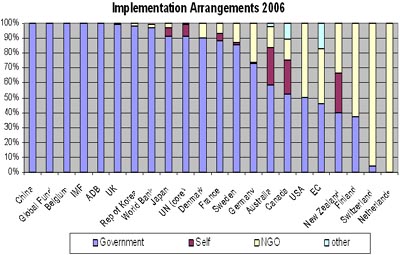
Source: CDC Database April 2007 The table in Annex Six provides further details of development partner implementation modalities and highlights the variation in arrangements that are made for implementation. While the ADB and China, for example, are included amongst those partners who channel 100% of their funds through Government, the Netherlands implements programmes exclusively through NGOs. Most development partners (e.g. Germany, 73% to Government; Australia, 58%; Canada, 53%; USA 50%) have adopted a mix of implementation arrangements. The charts above highlight that NGOs make an important contribution to the national development effort by managing the funds of other development partners and serving as implementing agencies. NGOs also represent a significant source of funds in their own right, however, and a June 2006 CDC/Danida 'Mapping Survey of NGO Presence and Activity in Cambodia' study found that:
The CDC database on NGO activity records the activities and funding modalities of some (but not all) of the main NGOs in Cambodia, although the incomplete nature of this data means that results must be interpreted with considerable care. The disbursements of the thirty largest registered NGOs (based on disbursements of combined core and non-core funds) are reported in the table below together with their main areas of activity. Table Seven. NGO Disbursements 2006, as reported to CDC (USD 000s) |
|||||||||||||||||||||||||||||||||||||||||||||||||||||||||||||||||||||||||||||||||||||||||||||||||||||||||||||||||||||||||||||||||||||||||||||||||||||||||||||||||||||||||||||||||||||||||||||||||||||||||||||||||||||||||||||||||||||||||||||||||||||||||||||||||||||||||||||||||||||||||||||||||||||||||||||||||||||||||||||||||||||||||||||||||||||||||||||||||||||||||||||||||||||||||||||||||||||||||||||||||
|
NGO |
Health |
Comm. & Social |
Rural Devt |
Educ. |
HIV/ AIDS |
Agric |
Transport |
Gov. & Adm. |
Other |
TOTAL |
|
Kantha Bopha Hospital |
21,229.3 |
|
|
|
|
|
|
|
|
21,229.3 |
|
Population Services International |
3,941.1 |
|
|
|
2,420.0 |
|
|
|
|
6,361.1 |
|
Medecins Sans Frontières (Belgium) |
2,714.5 |
|
|
|
|
|
|
|
|
2,714.5 |
|
Medecins Sans Frontières (France) |
2,080.9 |
|
|
|
|
|
|
|
|
2,080.9 |
|
Medecin du Monde |
1,844.7 |
|
|
|
|
|
|
|
|
1,844.7 |
|
Enfants D'asie Aspeca |
|
1,774.8 |
|
|
|
|
|
|
|
1,774.8 |
|
Room to Read |
|
|
|
1,719.5 |
|
|
|
|
|
1,719.5 |
|
Save the Children (Norway) |
79.3 |
|
|
1,295.0 |
110.1 |
26.3 |
145.0 |
|
16.7 |
1,672.4 |
|
SOS Children's Villages of Cambodia |
|
1,410.3 |
|
|
|
|
|
|
|
1,410.3 |
|
Oxfam (Great Britain) |
|
|
1,366.7 |
|
|
|
|
|
10.6 |
1,377.3 |
|
Action Aid International |
|
|
1,346.3 |
|
|
|
|
|
|
1,346.3 |
|
Jesuit Service Cambodia |
|
621.2 |
621.2 |
|
|
|
|
|
|
1,242.4 |
|
Friends Without A Border |
1,204.6 |
|
|
|
|
|
|
|
|
1,204.6 |
|
Lutheran World Federation |
732.3 |
|
457.9 |
|
|
|
|
|
|
1,190.2 |
|
VBNK |
|
597.3 |
157.7 |
207.9 |
|
|
|
|
|
962.9 |
|
HALO Trust |
|
|
|
|
|
|
|
|
807.8 |
807.8 |
|
Emerg Life Supp't for Civilian War Victims |
798.5 |
|
|
|
|
|
|
|
|
798.5 |
|
Conservation International Cambodia |
|
|
|
|
|
588.8 |
|
|
124.8 |
713.7 |
|
Rihs-South East Asia Committee |
|
|
|
690.2 |
|
|
|
|
|
690.2 |
|
CONCERN Worldwide |
|
|
673.6 |
|
|
|
|
|
|
673.6 |
|
Samaritan's Purse International Relief |
|
326.2 |
326.2 |
|
|
|
|
|
|
652.5 |
|
Handicap International (Belgium) |
428.6 |
36.6 |
|
77.4 |
|
|
|
36.6 |
|
579.2 |
|
HAGAR |
|
286.3 |
286.3 |
|
|
|
|
|
|
572.5 |
|
Krousar Thmey |
|
488.0 |
|
|
|
|
|
|
|
488.0 |
|
Food for the Hungry International |
|
|
422.5 |
|
|
|
|
|
|
422.5 |
|
Mennonite Central Committee |
|
|
381.5 |
|
|
|
|
|
|
381.5 |
|
Agricultural Development Denmark-Asia |
|
|
|
|
|
376.0 |
|
|
|
376.0 |
|
Cambodian Children's Fund |
|
|
|
358.3 |
|
|
|
|
|
358.3 |
|
Handicap International-France |
|
231.5 |
|
50.6 |
|
|
|
|
|
282.1 |
|
Harvest Mission International Cambodia |
|
278.3 |
|
|
|
|
|
|
|
278.3 |
|
TOTAL |
35,054 |
6,050 |
6,040 |
4,399 |
2,530 |
991 |
145 |
37 |
818 |
56,206 |
|
Source: CDC NGO Database (totals include NGO core funds and funds received from other development partners) |
|
Considerable caution must be exercised in interpreting data on NGO activity. This is highlighted by contrasting the data provided by NGOs themselves, shown above, with data provided by development partners on funds that they pass to NGOs. Table Eight. NGO Sector Support 2005-2006 (USD million, core and non-core)
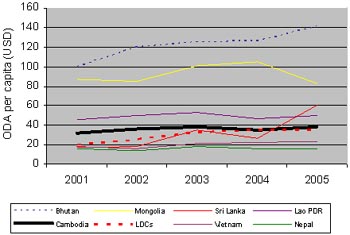
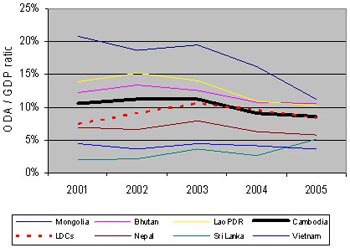
Source: CDC Database (*) and CDC NGO Database (**), April 2007 Table Eight, above, on sector financing in 2005 and 2006, consolidates all CDC data on NGO support across all sectors. This shows that NGOs contributed USD 50.2 million of their own resources in 2006, displaying a disbursement profile that is broadly in line with NSDP priorities. In addition to this core funding, these NGOs reportedly receive USD 63 million from development partners, nearly half of which is directed to governance-related work (very little of NGO core funds are used for governance work). Perhaps the most important conclusion to draw from combining these two datasets is that there are some significant anomalies. In particular, the significant level of support to NGOs for governance-related work reported by development partners does not appear to correspond with the data reported by NGOs (there are a number of prominent NGOs who do not appear in CDC records). HIV/AIDS provides an additional example of an activity that is understood to benefit from important NGO support – through both core and non-core funding - but the data reported here also appears to require further consideration as NGO-registered support from development partners (e.g. USD 2.4 million managed by Population Services International) has not been recorded by the funding donor in the CDC Database and NGOs report no direct core support in 2006. While this data on NGO support does provide some indication of the level and focus of the contribution of NGOs to the development effort – indeed there can be no question that their contribution is significant across many important sectors – it perhaps highlights above all that Government and NGOs need to strengthen their partnership so that each gains an enhanced understanding of the other's priorities and operations. Given the combined funding managed by the NGO community, this work, which will include the merging and reconciliation of the two datasets by CDC in 2007, will represent an important step toward more effective aid management and the realisation of improved development outcomes. Cambodia, Neighbouring Countries and LDCs: A Comparison of ODA Trends When considering broad disbursement trends in Cambodia, it is useful to view these figures in a wider context by taking account of trends elsewhere, in particular for other Least Developed Countries (LDCs) and neighbouring countries. Chart Ten, below, shows 5 year trends in ODA per capita in the left hand graph and, in the right hand graph, ODA/GDP ratios (note that Timor Leste is significantly higher at USD 190 and 53% of GDP and is omitted from the chart). The left hand chart shows that ODA per capita in Cambodia, which has remained relatively stable at between USD 35 and USD 40, has been slightly above the average for all LDCs over the period since 2001 but the gap has been closing as global ODA disbursements have increasingly sought to benefit the poorest countries. ODA as a share of GDP has declined steadily in the period since 2003, mainly due to robust rates of economic growth and the ratio is now very similar to that of the average for all LDCs. |
||||||||||||||||||||||||||||||||||||||||||||||||||||||||||||||||||||||||||||||||||||||||||||||||||||||||||||||||||||||||||||||||||||||||||||||||||||||||||||||||||||||||||||||||||||||||||||||||||||||||||||||||||||||||||||||||||||||||||||||||||||||||||||||||||
| Source: OECD/DAC
Database and World Bank World Development Indicators
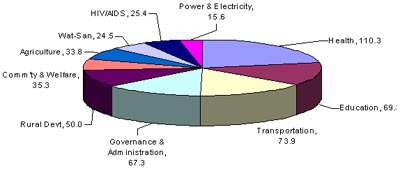
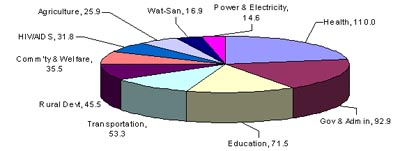
Trends in Development Assistance Disbursements to Priority Sectors A detailed overview of disbursements to the major sectors in the years 2002-2006 is presented in Table, Nine, overleaf. The classifications used for sector analysis were revised in 2006 to match the classification used in the NSDP, with additional sub-sectors added based on NSDP priorities and OECD/DAC categories (see Annex Seven). Analysis on the alignment of support to the NSDP was discussed in an earlier section. The analysis here attempts to identify the major funding changes since 2005 that may have been influenced by the NSDP (although it is recognized that a full realignment may be effected over the duration of each development partner's programming cycle). Table Nine. Sector Disbursement Trends 2002 – 2006 (USD million)
Source: CDC Database The ten largest sectors for each of 2005 and 2006 are shown in the pie charts. Health remains the largest recipient of development assistance, USD 110 million annually, representing a little under one-fifth of all aid.
assistance that may have taken place over the last years, it is instructive to consider the changes in aid allocations that have taken place by looking more closely at the data from 2005, the year before the NSDP was launched, and by then considering a slightly longer-term perspective by looking at changes since 2002. |
|||||||||||||||||||||||||||||||||||||||||||||||||||||||||||||||||||||||||||||||||||||||||||||||||||||||||||||||||||||||||||||||||||||||||||||||||||||||||||||||||||||||||||||||||||||||||||||||||||||||||||||||||||||||||||||||||||||||||||||||||||||||||||||||||||||||||||||||||||||||||||||||||||||||||||||||||||||||||||||||||
|
| Content | Back | Top | Next | |
|
Home | 1st CDCF Meeting | 8th CG Meeting | Partnership and Harmonization TWG | GDCC | Policy Documents Guidelines | Donor Dev. Coop. Pgm. | NGO |