|
|
 |
 |
 |
||
|
|
|
|
|
|
|
||
|
|
|
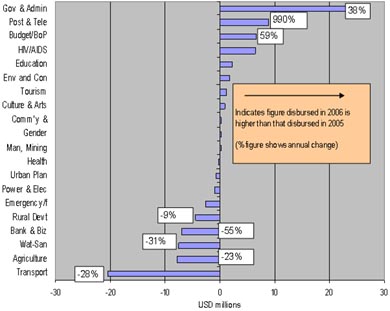
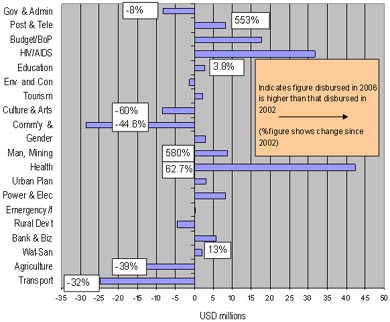
Chart Thirteen. Reallocations of Development Assistance Between Sectors |
|
| Reallocations between 2005 and 2006 | Reallocations between 2002 and 2006 |
 |
 |
| Source: CDC Database |
|
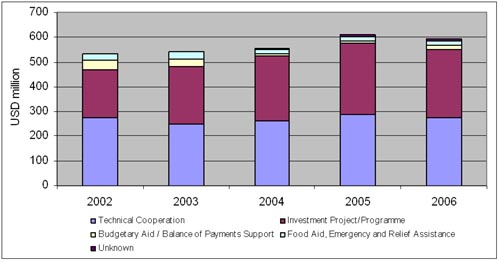
Consistent with the analysis presented earlier on NSDP alignment, agriculture and transport are shown to have experienced a decline across both periods, which is surprising given that these sectors are central to the growth components of the NSDP. Other than that there does not appear to be any clear trend between changes in the last year and over the previous five. The health and HIV/AIDS sectors have benefited from the largest increases since 2002, although in percentage terms the biggest increases are in the manufacturing and telecommunications sectors. It is also notable that, despite receiving the largest increase in absolute terms last year, allocations to governance and administrative reform have actually fallen quite sharply since 2002. This next section considers the types of support provided to Cambodia. Each modality makes a potentially significant contribution to the NSDP but, at both macro and sectoral levels, it is necessary to recognise the complementary roles of different types of support. It is the role of Government, in dialogue with TWGs, to consider the appropriate mix of development assistance modalities within each sector. An analysis of trends in types of aid is essentially confined to a consideration of technical cooperation (shown as combined in the chart overleaf) and investment support; other forms of support are relatively insignificant compared to these two modalities. Over the past five years, it can be seen that investment support has grown considerably from USD 191 million to USD 276 million. By contrast, technical cooperation remains unchanged at USD 275 million and has been broadly stable throughout the period. Table Ten. Disbursement by Type of Assistance 2002-2006 (USD million) |
|
Type of Assistance |
Terms of Assistance |
2002 |
2003 |
2004 |
2005 |
2006 Provisional |
|||||
|
US $ |
% |
US $ |
% |
US $ |
% |
US $ |
% |
US $ |
% |
||
|
Technical Cooperation |
Grants |
251.6 |
47.4 |
247.1 |
45.8 |
263.5 |
47.5 |
287.3 |
47.1 |
274.4 |
46.1 |
|
Loans |
23.8 |
4.5 |
0.0 |
0.0 |
0.0 |
0.0 |
0.0 |
0.0 |
0.5 |
0.1 |
|
|
TOTAL |
275.4 |
51.9 |
247.1 |
45.8 |
263.5 |
47.5 |
287.3 |
47.1 |
274.9 |
46.2 |
|
|
o/w Free-Standing |
Grants |
227.6 |
42.9 |
185.4 |
34.4 |
177.1 |
31.9 |
260.3 |
42.7 |
243.3 |
40.9 |
|
Loans |
0.0 |
0.0 |
0.0 |
0.0 |
0.0 |
0.0 |
0.0 |
0.0 |
0.5 |
0.1 |
|
|
TOTAL |
227.6 |
42.9 |
185.4 |
34.4 |
177.1 |
31.9 |
260.3 |
42.7 |
243.8 |
41.0 |
|
|
o/w Investment-Related |
Grants |
24.0 |
4.5 |
61.7 |
11.4 |
86.4 |
15.6 |
27.0 |
4.4 |
31.1 |
5.2 |
|
Loans |
23.8 |
4.5 |
0.0 |
0.0 |
0.0 |
0.0 |
0.0 |
0.0 |
0.0 |
0.0 |
|
|
TOTAL |
47.8 |
9.0 |
61.7 |
11.4 |
86.4 |
15.6 |
27.0 |
4.4 |
31.1 |
5.2 |
|
|
Investment Project/Programme |
Grants |
54.3 |
10.2 |
94.6 |
17.5 |
72.6 |
13.1 |
118.9 |
19.5 |
140.7 |
23.7 |
|
Loans |
136.8 |
25.8 |
138.2 |
25.6 |
188.2 |
33.9 |
171.2 |
28.1 |
135.6 |
22.8 |
|
|
TOTAL |
191.1 |
36.0 |
232.9 |
43.2 |
260.8 |
46.9 |
290.1 |
47.6 |
276.3 |
46.5 |
|
|
Budgetary Aid / Balance of Payments Support |
Grants |
16.8 |
3.2 |
4.2 |
0.8 |
6.4 |
1.1 |
6.9 |
1.1 |
15.1 |
2.5 |
|
Loans |
22.6 |
4.3 |
27.9 |
5.2 |
0.0 |
0.0 |
0.0 |
0.0 |
0.0 |
0.0 |
|
|
TOTAL |
39.4 |
7.4 |
32.1 |
5.9 |
6.4 |
1.1 |
6.9 |
1.1 |
15.1 |
2.5 |
|
|
Food Aid, Emergency and Relief Assistance |
Grants |
25.0 |
4.7 |
27.5 |
5.1 |
20.2 |
3.6 |
17.1 |
2.8 |
18.8 |
3.2 |
|
Loans |
0.0 |
0.0 |
0.0 |
0.0 |
0.0 |
0.0 |
0.0 |
0.0 |
0.0 |
0.0 |
|
|
TOTAL |
25.0 |
4.7 |
27.5 |
5.1 |
20.2 |
3.6 |
17.1 |
2.8 |
18.8 |
3.2 |
|
|
Not specified |
Grants |
0.0 |
0.0 |
0.0 |
0.0 |
4.6 |
0.8 |
8.5 |
1.4 |
9.6 |
1.6 |
|
Loans |
0.0 |
0.0 |
0.0 |
0.0 |
0.0 |
0.0 |
0.0 |
0.0 |
0.0 |
0.0 |
|
|
TOTAL |
0.0 |
0.0 |
0.0 |
0.0 |
4.6 |
0.8 |
8.5 |
1.4 |
9.6 |
1.6 |
|
|
Total Disbursements |
Grants |
347.7 |
65.5 |
373.4 |
69.2 |
367.2 |
66.1 |
438.8 |
71.9 |
458.6 |
77.1 |
|
Loans |
183.2 |
34.5 |
166.1 |
30.8 |
188.2 |
33.9 |
171.2 |
28.1 |
136.1 |
22.9 |
|
|
TOTAL |
530.9 |
100.0 |
539.5 |
100.0 |
555.4 |
100.0 |
610.0 |
100.0 |
594.8 |
100.0 |
|
|
Source: CDC Database As a result of these trends, the investment share in aid disbursements has increased from 36% in 2002 to 46.5% in 2006, while the respective share for technical cooperation, presented in Table Ten, has decreased from 52% to 46%. It is also notable that 2005 and 2006 were the first years in which investment-related support exceeded the supply of technical cooperation. Chart Fourteen. Disbursement by Type of Assistance 2002-2006
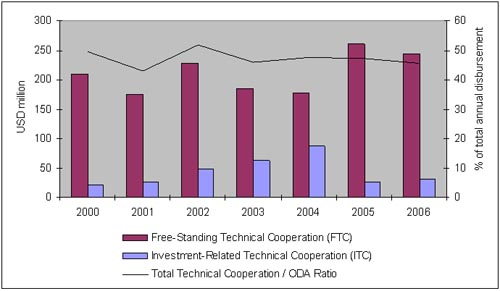
Source: CDC Database The type of assistance that often requires more in-depth analysis is technical cooperation, which accounts for a significant share of total assistance and is intended to make a major contribution to the national capacity development effort. The Royal Government has previously communicated its views on the use of technical cooperation in supporting the NSDP (see NSDP page 83) and the chart below shows disbursements of free-standing technical cooperation and investment related technical cooperation over the period 2000-2006, together with the combined ratio. Investment-related technical cooperation, which is associated with supporting capital investments, increased from less than 5% of disbursements in 2000 to USD 86.4 million (15.6% of disbursements) in 2004, before once again declining to USD 31 million (5.2%) in 2006. Free-standing technical cooperation, which provides policy-related and capacity development support, has declined from about 45% of total disbursements in 2000 to 41% in 2006. This reduction appears to be in line with the reduced overall support to governance reforms, which is a sector strongly associated with free-standing technical cooperation, in the same period. During the data collection exercise for the Report it was noticeable that many partners had difficulty in making the distinction between investment-related and free-standing technical cooperation and the reliability of the analysis is therefore open to question5. For this reason, for analytical purposes it may therefore be more useful to consider aggregate technical cooperation, i.e. the combined total of free-standing and investment-related technical cooperation. On this basis it can be seen that the total amount of development assistance allocated to technical cooperation remains very high, approaching almost 50% of total disbursements in 2006, but further analysis may be inconclusive given the concerns relating to data integrity. Chart Fifteen. Technical Cooperation 2000-2006
Source: CDC Database Moving beyond aggregate disbursements of technical cooperation, Table Eleven, overleaf, shows the disbursement of technical cooperation, and other modalities, by development partner in the years 2005 and 2006. Based on the data provided by development partners it can be seen that the US is the largest provider of technical cooperation, providing USD 51 million of support in 2006. Similar to Finland, Canada, and New Zealand, the bilateral development assistance provided by the US comprises wholly of technical cooperation. These results are informative but, as noted above, many development partner data focal points communicated their lack of understanding about TC definitions and classifications. This may have resulted in a higher than usual error in the data and indicates that we need to work much harder to understand how technical cooperation is provided, how it is used and how it is managed. This is much more than a data issue. As the main catalyst for strengthening national systems, supporting the development of national policy, and delivering high-quality capacity development assistance that will move Cambodia forward on the path toward reaching its NSDP objectives, the lack of robust data on technical cooperation leaves a significant gap to be filled in the 'managing for results' approach. Although the exact amounts and uses of technical cooperation are not known, it can be said with some certainty to be 'large', accounting for about half of all development cooperation, and if commitments to promote aid effectiveness are sincere then Government will need to work much harder with development partners to understand more about the use of this resource. This might be considered an important component of both the 'managing for results' and 'mutual accountability' components of the H-A-R Action Plan and the Declaration on Aid Effectiveness that most partners signed in 2006. Table Eleven. Development Partner Disbursements by Type of Assistance (USD million) |
|
Development Partner |
2005 |
2006 provisional |
|||||||||||||
|
FTC |
ITC |
IPA |
Budget Supp't |
FOA |
Not spec. |
Total |
FTC |
ITC |
IPA |
Budget Supp't |
FOA |
Not spec. |
Total |
||
|
United Nations Agencies |
|
|
|
|
|
|
|
|
|
|
|
|
|
|
|
|
|
FAO |
0.3 |
|
|
|
0.2 |
|
0.5 |
1.1 |
|
|
|
|
|
1.1 |
|
|
IFAD |
|
|
4.7 |
|
|
|
4.7 |
|
|
4.1 |
|
|
|
4.1 |
|
|
ILO |
3.4 |
|
|
|
|
|
3.4 |
4.3 |
|
|
|
|
|
4.3 |
|
|
UNAIDS |
|
|
|
|
|
|
|
0.4 |
|
|
|
|
|
0.4 |
|
|
UNCOHCHR |
|
|
|
|
|
|
|
|
|
|
|
|
|
|
|
|
UNDP |
6.0 |
|
|
|
|
|
6.0 |
8.1 |
|
|
|
|
|
8.1 |
|
|
UNESCO |
2.5 |
|
|
|
|
|
2.5 |
2.1 |
|
|
|
|
|
2.1 |
|
|
UNFPA |
2.8 |
|
|
|
|
|
2.8 |
2.6 |
|
|
|
|
|
2.6 |
|
|
UNICEF |
3.3 |
3.3 |
|
|
|
|
6.7 |
|
3.70 |
|
|
|
|
3.7 |
|
|
UNODC |
0.3 |
|
|
|
|
|
0.3 |
0.2 |
|
|
|
|
|
0.2 |
|
|
WFP |
|
|
|
|
14.0 |
|
14.0 |
|
|
|
|
17.9 |
|
17.9 |
|
|
WHO |
0.3 |
|
|
|
|
|
0.3 |
3.1 |
|
|
|
|
|
3.1 |
|
Int'l Financial Institutions |
|
|
|
|
|
|
|
|
|
|
|
|
|
|
|
|
|
World Bank |
1.4 |
0.2 |
36.20 |
|
|
|
37.8 |
1.9 |
0.30 |
24.4 |
|
|
|
26.6 |
|
|
IMF |
0.3 |
|
|
|
|
|
0.3 |
0.2 |
|
|
|
|
|
0.2 |
|
|
ADB |
4.8 |
|
84.60 |
|
|
|
89.4 |
7.4 |
|
54.6 |
|
|
|
62.0 |
|
Others |
|
|
|
|
|
|
|
|
|
|
|
|
|
|
|
|
|
Global Fund |
0.3 |
|
18.50 |
|
|
|
18.8 |
0.6 |
|
21.5 |
|
|
|
22.2 |
|
Sub-Total UN/Multilateral |
25.8 |
3.6 |
144.0 |
0.0 |
14.2 |
0.0 |
187.5 |
32.2 |
4.0 |
104.7 |
0.0 |
17.9 |
0.0 |
158.8 |
|
|
European Union |
|
|
|
|
|
|
|
|
|
|
|
|
|
|
|
|
|
EC |
21.7 |
1.8 |
|
|
|
0.2 |
23.7 |
31.7 |
|
|
3.6 |
|
|
35.2 |
|
|
Belgium |
11.4 |
|
|
|
|
0.3 |
11.7 |
6.9 |
|
0.1 |
|
|
0.4 |
7.3 |
|
|
Denmark |
0.5 |
3.9 |
0.4 |
|
|
|
4.8 |
3.3 |
2.7 |
0.1 |
|
|
|
6.1 |
|
|
Finland |
3.3 |
|
|
|
|
|
3.3 |
3.5 |
|
|
|
|
|
3.5 |
|
|
France |
15.4 |
3.0 |
6.0 |
|
|
|
24.4 |
6.4 |
2.5 |
13.1 |
|
|
|
22.0 |
|
|
Germany |
13.0 |
0.1 |
6.5 |
|
|
7.7 |
27.3 |
13.2 |
|
8.2 |
|
|
9.1 |
30.5 |
|
|
Netherlands |
1.1 |
|
|
|
|
|
1.1 |
0.1 |
|
|
|
|
|
0.1 |
|
|
Sweden |
1.8 |
5.3 |
5.8 |
0.70 |
|
|
13.6 |
2.4 |
7.4 |
6.3 |
|
|
|
16.1 |
|
|
UK |
15.8 |
3.3 |
1.5 |
|
|
|
20.6 |
12.6 |
1.6 |
5.9 |
|
|
|
20.0 |
|
Sub-Total EU |
84.2 |
17.3 |
20.2 |
0.7 |
0.0 |
8.1 |
130.6 |
80.0 |
14.1 |
33.6 |
3.6 |
0.0 |
9.5 |
140.8 |
|
|
Other Bilaterals |
|
|
|
|
|
|
|
|
|
|
|
|
|
|
|
|
|
Australia |
7.1 |
5.9 |
0.9 |
|
2.9 |
|
16.8 |
12.6 |
4.4 |
|
|
0.3 |
|
17.3 |
|
|
Canada |
9.1 |
|
|
|
|
|
9.1 |
5.7 |
|
|
|
|
|
5.7 |
|
|
China |
|
|
46.5 |
|
|
|
46.6 |
0.4 |
|
52.8 |
|
|
|
53.2 |
|
|
Japan |
38.2 |
|
67.2 |
6.3 |
|
|
111.7 |
34.8 |
|
54.1 |
11.5 |
|
|
100.5 |
|
|
New Zealand |
2.0 |
0.1 |
|
|
|
|
2.1 |
1.0 |
0.5 |
|
|
|
|
1.5 |
|
|
Rep of Korea |
5.8 |
|
9.1 |
|
|
|
14.9 |
7.6 |
0.5 |
5.1 |
|
|
|
13.3 |
|
|
Switzerland |
0.2 |
|
2.2 |
|
|
0.4 |
2.8 |
0.1 |
0.4 |
2.0 |
|
|
|
2.5 |
|
|
USA |
43.3 |
|
|
|
|
|
43.3 |
51.0 |
|
|
|
|
|
51.0 |
|
Sub-Total Other Bilateral |
105.6 |
6.1 |
125.9 |
6.3 |
2.9 |
0.4 |
247.2 |
113.2 |
5.8 |
114.1 |
11.5 |
0.3 |
0.0 |
245.0 |
|
|
NGOs (core funds) |
44.7 |
|
|
|
|
|
44.7 |
18.4 |
7.2 |
24.0 |
|
0.6 |
|
50.2 |
|
|
Total |
260.3 |
27.0 |
290.1 |
6.9 |
17.1 |
8.5 |
610.0 |
243.8 |
31.1 |
276.3 |
15.1 |
18.8 |
9.6 |
594.8 |
|
|
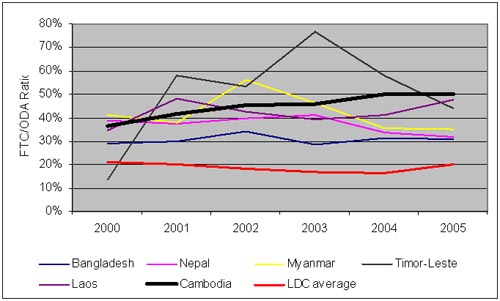
Source: CDC Database An illustrative look at regional data also provides an informative insight into the use of technical cooperation. Using OECD/DAC data and definitions it is possible to compare technical cooperation ratios in Bangladesh, Cambodia, Nepal, Myanmar, Timor-Leste and Laos in the period since 20006. In Cambodia technical cooperation has been steadily increasing and, as Chart Sixteen shows, was highest in 2004 and 2005 when it accounts for about half of all development cooperation. This may be counter-intuitive as one might expect many years of significant technical cooperation to have had a greater impact on the development of national systems and capacity by now. It is interesting to note in some other Asian countries, for example, that the share of technical cooperation in aid has decreased in recent years while the average ratio for all LDCs has remained broadly constant at about 20% of all ODA, i.e. less than half that received by Cambodia. Questions regarding the use and impact of technical cooperation in Cambodia may be particularly pertinent. Chart Sixteen. Technical Cooperation Ratios in Asian Developing Countries
Source: OECD/DAC (Note that technical cooperation data and definitions differ from CDC Database The increase in the technical cooperation ratio in Cambodia to 50% since 2000 warrants the attention of both the Government and its development partners. As stated above, it is necessary to understand much more about the size and nature of technical cooperation. Only then will Government be able to assert coherent ownership over the assistance that is provided by development partners and, in this way, to ensure an effective contribution to developing national capacity and to honouring the commitments both parties made when signing the Paris Declaration. Summary Data Presentations and Sector Profiles The next four pages of this Report provide a series of snapshots of summary data on four of the NSDP priority sectors (agriculture, education, health and infrastructure). For each of these sectors more detail is shown on their respective sub-sectors than in the analysis presented above. While noting that there may be some data discrepancies, the purpose of this exercise is to demonstrate the utility of the CDC Database in producing routine reports and in providing tools that can add value to the dialogue that takes place at sector level. These data presentations are felt to be of significant value to a wide range of users who require 'at a glance' briefings or sector summaries. Once data has been properly validated they may be routinely replicated from the CDC Database for all sectors. The sector profiles are not simply for briefing purposes, however, as, besides presenting key data on external support to a sector and its sub-sectors, they have been constructed to succinctly highlight the nature of the aid coordination challenge within a sector. Each profile shows, for example:
These profiles are linked to the CDC Database meaning that the information is therefore routinely up-dated as new project information is entered into the Database. In the latter half of 2007 these profiles will also be posted onto the CRDB/CDC website so that all users can routinely access snapshot information on all of the main sectors that receive development assistance. These profiles are currently being piloted and it is intended that, after the data has been validated by lead ministries and TWGs, they will make a useful contribution to dialogue at sector level. |
|
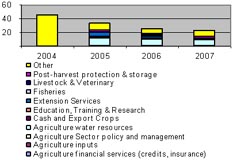
Agriculture
Sector Profile |
|||||||||||||||||||||||||
|
Sector Background |
TWG Details |
||||||||||||||||||||||||
|
NSDP priorities are now incorporated into a programme-based strategy for agriculture and water and detailed programs are now being prepared. The lead RGC agencies in agriculture and water resources are MAFF and MOWRM respectively.
|
Main TWG: Agriculture and Water Contact email: twgaw@camnet.com.kh RGC members: MAFF, MOC, MEF, MLMUPC, MRD, MWRM, CARD Donor members: Australia, Canada, Japan, New Zealand, Germany, Denmark, France, EC, ADB, FAO, IFAD, UNDP, WB, WFP, CEDAC, GRET. |
||||||||||||||||||||||||
|
|
|
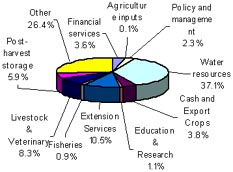
Sub-sector ODA (2006) |
ODA Profile (2006) |
10 Biggest
Projects |
|||||||||||||||||||||||||||||||||||||||||||||||||||||||||||||||||||||||||||
|
|
|
|||||||||||||||||||||||||||||||||||||||||||||||||||||||||||||||||||||||||||
| 2006 Sub-sector Disbursements | 2007 ODA Projections | ODA Trends 2004 – 2007 (USD m) | |||||||||||||||||||||||||||||||||||||||||||||||||||||||||||||||||||||||||||
|
|
|
|||||||||||||||||||||||||||||||||||||||||||||||||||||||||||||||||||||||||||
| Province-level support | Paris Declaration Indicators | |||||||||||||||||||||||||||||||||||||||||||||||||||||
|
|
|
|
| Joint Monitoring Indicator Number 8 |
Status (March 2006) |
|
i) Develop a medium term strategy for agriculture and water |
Strategy finalised |
|
ii) Establish a mechanism and disseminate information on economic land concessions |
Available on http://www.twgaw.org/ |
|
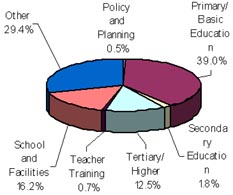
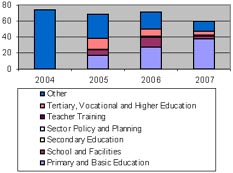
Education Sector Profile |
|||||||||||||||||||||||||
|
Sector Background |
TWG Details |
||||||||||||||||||||||||
|
Capacity and human resources are part of the Rectangular Strategy. The Education Strategic Plan (ESP) 2006-2010 has been designed to accelerate the speed of education reform NSDP.
|
TWG Chair: H.E. Mak Vann (MoEYS) |
||||||||||||||||||||||||
|
Sub-sector ODA (2006) |
ODA Profile (2006) |
10 Biggest
Projects |
|||||||||||||||||||||||||||||||||||||||||||||||||||||||||||||||
|
|
|
|||||||||||||||||||||||||||||||||||||||||||||||||||||||||||||||
| 2006 Sub-sector Disbursements | 2007 ODA Projections | ODA Trends 2004 – 2007 (USD m) | |||||||||||||||||||||||||||||||||||||||||||||||||||||||||||||||
|
|
|
|||||||||||||||||||||||||||||||||||||||||||||||||||||||||||||||
| Province-level support | Paris Declaration Indicators | |||||||||||||||||||||||||||||||||||||||||||||||||||||
|
|
|
Joint Monitoring Indicator Number 8 |
Status (March 2006) |
|
Increase the net enrolment in primary school (total, and by sex) |
Total NER decreased from 91.9% 04/05 to 91.3% 05/06 and is directly correlated with the decrease in population growth rates. |
|
Increase the survival rate from grades 1 to 6. |
Total SR decreased from 52.6% 04/05 to 48.1% 05/06. Increased drop-out rates will receive the Ministry’s highest consideration at the next policy review. |
|
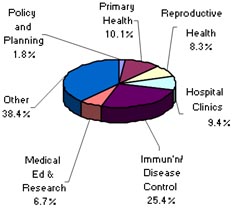
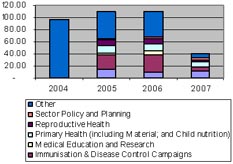
Health Sector Profile |
|||||||||||||||||||||||||||||
|
Sector Background |
TWG Details |
||||||||||||||||||||||||||||
|
The Health Sector Strategic Plan (HSP), 2003-2010, provides the guiding framework. Health is one of the four priority sectors for PAP, which assures allocation and release of current and capital budgetary funds.
|
TWG Chair: H.E. Nuth Sokhom (MoH) |
||||||||||||||||||||||||||||
|
Sub-sector ODA (2006) |
ODA Profile (2006) |
10 Biggest
Projects |
|||||||||||||||||||||||||||||||||||||||||||||||||||||||||||||||
|
|
|
|||||||||||||||||||||||||||||||||||||||||||||||||||||||||||||||
| 2006 Sub-sector Disbursements | 2007 ODA Projections | ODA Trends 2004 – 2007 (USD m) | |||||||||||||||||||||||||||||||||||||||||||||||||||||||||||||||
|
|
|
|||||||||||||||||||||||||||||||||||||||||||||||||||||||||||||||
| Province-level support | Paris Declaration Indicators | |||||||||||||||||||||||||||||||||||||||||||||||||||||
|
|
|
Joint Monitoring Indicator Number 8 |
Status (March 2006) |
|
Increase the proportion of deliveries attended by skilled health personnel |
Increased from 31.8% in 2000 to 43.8% in 2005 |
|
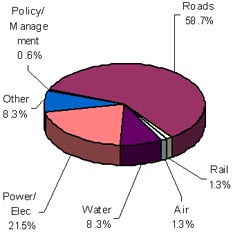
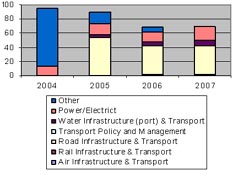
Infrastructure Sector Profile |
|||||||||||||
|
Sector Background |
TWG Details |
||||||||||||
|
The NSDP elaborates Rectangular Strategy priorities that include transport infrastructure, water resources, energy, and information communications technology. Infrastructure is emphasised for its forward and backward linkages to rural development, trade and all productive sectors. The transport infrastructure sector includes roads, railways, ports, civil aviation.
|
TWG Chair:
H.E. Mr. Sun Chan Thol |
||||||||||||
|
Sub-sector ODA (2006) |
ODA Profile (2006) |
10 Biggest
Projects |
|||||||||||||||||||||||||||||||||||||||||||||||||||||||||||||||
|
|
|
|||||||||||||||||||||||||||||||||||||||||||||||||||||||||||||||
| 2006 Sub-sector Disbursements | 2007 ODA Projections | ODA Trends 2004 – 2007 (USD m) | |||||||||||||||||||||||||||||||||||||||||||||||||||||||||||||||
|
|
|
|||||||||||||||||||||||||||||||||||||||||||||||||||||||||||||||
| Province-level support | Paris Declaration Indicators | |||||||||||||||||||||||||||||||||||||||||||||||||||||||
|
|
|
Joint Monitoring Indicator Number 8 |
Status (March 2006) |
|
Further infrastructure rehabilitation for sustainable socio-economic development: (a) budget allocations for roads; (b) Road law to CoM; (c) Telecom Law to CoM; (c) Water Supply Law to CoM; (d) Wood Energy Statistics & Policy. |
All JMIs have been achieved. Draft laws submitted to CoM, maintenance issues subject to IMC deliberation and Wood Energy draft forthcoming. |
|
| Content | Back | Top | Next | |
|
Home | 1st CDCF Meeting | 8th CG Meeting | Partnership and Harmonization TWG | GDCC | Policy Documents Guidelines | Donor Dev. Coop. Pgm. | NGO |